
Page 176 - Machine Learning for Subsurface Characterization
P. 176
150 Machine learning for subsurface characterization
j P Mj
RE ¼ (5.11)
M
where P is the predicted value and M is the measured value of either DTS or
DTC log at a depth i. RE values are first separately calculated for the DTC
and DTS logs; then the two RE values corresponding to the two targets are
averaged at each depth to represent the overall prediction performance of a
shallow-learning model for any given depth. Averaged RE at each depth is
further averaged over 50-ft depth intervals to reduce the effects of noise,
borehole rugosity, and thin layers. The averaged RE will better describe the
overall performance of a model in formations with different lithologies.
Later, this final form of the averaged RE is compared with the averaged
cluster numbers generated by the clustering methods to identify a clustering
technique that can be used to indicate the reliability of regression-based
synthesis of DTS and DTC logs in new wells without these logs.
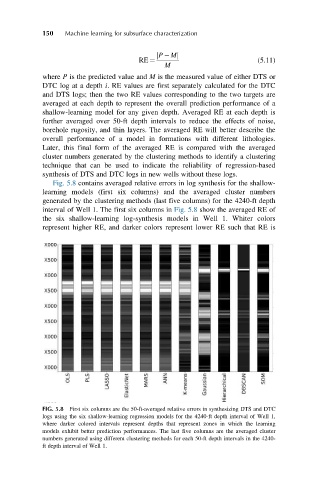
Fig. 5.8 contains averaged relative errors in log synthesis for the shallow-
learning models (first six columns) and the averaged cluster numbers
generated by the clustering methods (last five columns) for the 4240-ft depth
interval of Well 1. The first six columns in Fig. 5.8 show the averaged RE of
the six shallow-learning log-synthesis models in Well 1. Whiter colors
represent higher RE, and darker colors represent lower RE such that RE is
FIG. 5.8 First six columns are the 50-ft-averaged relative errors in synthesizing DTS and DTC
logs using the six shallow-learning regression models for the 4240-ft depth interval of Well 1,
where darker colored intervals represent depths that represent zones in which the learning
models exhibit better prediction performances. The last five columns are the averaged cluster
numbers generated using different clustering methods for each 50-ft depth intervals in the 4240-
ft depth interval of Well 1.