
Page 179 - Machine Learning for Subsurface Characterization
P. 179
Robust geomechanical characterization Chapter 5 153
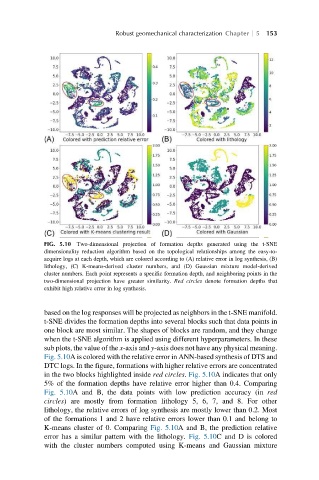
FIG. 5.10 Two-dimensional projection of formation depths generated using the t-SNE
dimensionality reduction algorithm based on the topological relationships among the easy-to-
acquire logs at each depth, which are colored according to (A) relative error in log synthesis, (B)
lithology, (C) K-means-derived cluster numbers, and (D) Gaussian mixture model-derived
cluster numbers. Each point represents a specific formation depth, and neighboring points in the
two-dimensional projection have greater similarity. Red circles denote formation depths that
exhibit high relative error in log synthesis.
based on the log responses will be projected as neighbors in the t-SNE manifold.
t-SNE divides the formation depths into several blocks such that data points in
one block are most similar. The shapes of blocks are random, and they change
when the t-SNE algorithm is applied using different hyperparameters. In these
sub plots, the value of the x-axis and y-axis does not have any physical meaning.
Fig. 5.10A is colored with the relative error in ANN-based synthesis of DTS and
DTC logs. In the figure, formations with higher relative errors are concentrated
in the two blocks highlighted inside red circles. Fig. 5.10A indicates that only
5% of the formation depths have relative error higher than 0.4. Comparing
Fig. 5.10A and B, the data points with low prediction accuracy (in red
circles) are mostly from formation lithology 5, 6, 7, and 8. For other
lithology, the relative errors of log synthesis are mostly lower than 0.2. Most
of the formations 1 and 2 have relative errors lower than 0.1 and belong to
K-means cluster of 0. Comparing Fig. 5.10A and B, the prediction relative
error has a similar pattern with the lithology. Fig. 5.10C and D is colored
with the cluster numbers computed using K-means and Gaussian mixture