
Page 177 - Machine Learning for Subsurface Characterization
P. 177
Robust geomechanical characterization Chapter 5 151
inversely related to the performance of the log-synthesis model. The six log-
synthesis models exhibit very similar patterns of RE over the entire depth
interval, as shown in the six columns of Fig. 5.8. The six models perform
badly in the upper middle part of the selected formation (around 1250–
1800 ft. below the top of the formation depth under investigation). Possibly
the zone of poor log-synthesis performance has certain physical properties
that are very different from the rest or those where the logs have very distinct
statistical features. In the following sections, clustering methods process the
“easy-to-acquire” logs to identify clusters that exhibit high correlation with
the relative errors of the synthesized DTC and DTS logs.
3.3 Performance of clustering-based reliability of sonic-log synthesis
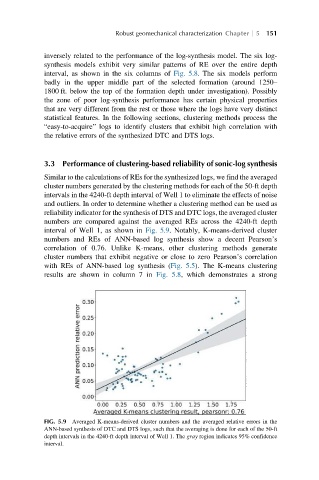
Similar to the calculations of REs for the synthesized logs, we find the averaged
cluster numbers generated by the clustering methods for each of the 50-ft depth
intervals in the 4240-ft depth interval of Well 1 to eliminate the effects of noise
and outliers. In order to determine whether a clustering method can be used as
reliability indicator for the synthesis of DTS and DTC logs, the averaged cluster
numbers are compared against the averaged REs across the 4240-ft depth
interval of Well 1, as shown in Fig. 5.9. Notably, K-means-derived cluster
numbers and REs of ANN-based log synthesis show a decent Pearson’s
correlation of 0.76. Unlike K-means, other clustering methods generate
cluster numbers that exhibit negative or close to zero Pearson’s correlation
with REs of ANN-based log synthesis (Fig. 5.5). The K-means clustering
results are shown in column 7 in Fig. 5.8, which demonstrates a strong
FIG. 5.9 Averaged K-means-derived cluster numbers and the averaged relative errors in the
ANN-based synthesis of DTC and DTS logs, such that the averaging is done for each of the 50-ft
depth intervals in the 4240-ft depth interval of Well 1. The gray region indicates 95% confidence
interval.