
Page 318 - Machine Learning for Subsurface Characterization
P. 318
278 Machine learning for subsurface characterization
AdaBoost, Naı ¨ve Bayes, ANN, and voting classifier. Seventy percent of the
samples in the each of the four dataset (40,000 or 80,000 samples with 28
features and one target label) are randomly selected as training samples,
and the remaining dataset forms the testing samples. Grid search and cross
validation method are used to tune the hyperparameters of the classifiers to
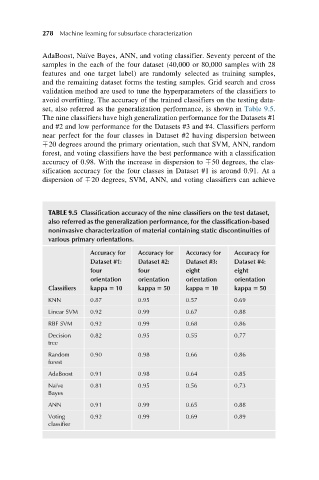
avoid overfitting. The accuracy of the trained classifiers on the testing data-
set, also referred as the generalization performance, is shown in Table 9.5.
The nine classifiers have high generalization performance for the Datasets #1
and #2 and low performance for the Datasets #3 and #4. Classifiers perform
near perfect for the four classes in Dataset #2 having dispersion between
þ20 degrees around the primary orientation, such that SVM, ANN, random
forest, and voting classifiers have the best performance with a classification
accuracy of 0.98. With the increase in dispersion to þ50 degrees, the clas-
sification accuracy for the four classes in Dataset #1 is around 0.91. At a
dispersion of þ20 degrees, SVM, ANN, and voting classifiers can achieve
TABLE 9.5 Classification accuracy of the nine classifiers on the test dataset,
also referred as the generalization performance, for the classification-based
noninvasive characterization of material containing static discontinuities of
various primary orientations.
Accuracy for Accuracy for Accuracy for Accuracy for
Dataset #1: Dataset #2: Dataset #3: Dataset #4:
four four eight eight
orientation orientation orientation orientation
Classifiers kappa 5 10 kappa 5 50 kappa 5 10 kappa 5 50
KNN 0.87 0.95 0.57 0.69
Linear SVM 0.92 0.99 0.67 0.88
RBF SVM 0.92 0.99 0.68 0.86
Decision 0.82 0.95 0.55 0.77
tree
Random 0.90 0.98 0.66 0.86
forest
AdaBoost 0.91 0.98 0.64 0.85
Naı ¨ve 0.81 0.95 0.56 0.73
Bayes
ANN 0.91 0.99 0.65 0.88
Voting 0.92 0.99 0.69 0.89
classifier