
Page 313 - Machine Learning for Subsurface Characterization
P. 313
274 Machine learning for subsurface characterization
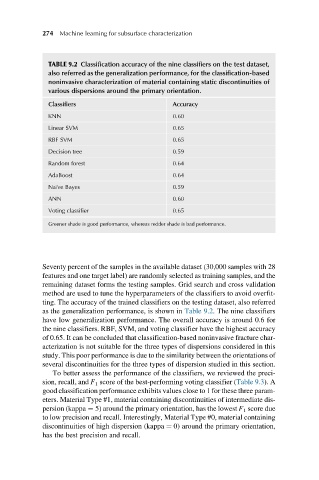
TABLE 9.2 Classification accuracy of the nine classifiers on the test dataset,
also referred as the generalization performance, for the classification-based
noninvasive characterization of material containing static discontinuities of
various dispersions around the primary orientation.
Classifiers Accuracy
KNN 0.60
Linear SVM 0.65
RBF SVM 0.65
Decision tree 0.59
Random forest 0.64
AdaBoost 0.64
Naı ¨ve Bayes 0.59
ANN 0.60
Voting classifier 0.65
Greener shade is good performance, whereas redder shade is bad performance.
Seventy percent of the samples in the available dataset (30,000 samples with 28
features and one target label) are randomly selected as training samples, and the
remaining dataset forms the testing samples. Grid search and cross validation
method are used to tune the hyperparameters of the classifiers to avoid overfit-
ting. The accuracy of the trained classifiers on the testing dataset, also referred
as the generalization performance, is shown in Table 9.2. The nine classifiers
have low generalization performance. The overall accuracy is around 0.6 for
the nine classifiers. RBF, SVM, and voting classifier have the highest accuracy
of 0.65. It can be concluded that classification-based noninvasive fracture char-
acterization is not suitable for the three types of dispersions considered in this
study. This poor performance is due to the similarity between the orientations of
several discontinuities for the three types of dispersion studied in this section.
To better assess the performance of the classifiers, we reviewed the preci-
sion, recall, and F 1 score of the best-performing voting classifier (Table 9.3). A
good classification performance exhibits values close to 1 for these three param-
eters. Material Type #1, material containing discontinuities of intermediate dis-
persion (kappa ¼ 5) around the primary orientation, has the lowest F 1 score due
to low precision and recall. Interestingly, Material Type #0, material containing
discontinuities of high dispersion (kappa ¼ 0) around the primary orientation,
has the best precision and recall.