
Page 311 - Machine Learning for Subsurface Characterization
P. 311
discon-
150 150
135
120 100 orientations of
105 50
80 0 Fracture orientation °
Sensors Source 75 60 X (mm) Kappa = 1000 –50 the and
45 –100
30 negligible,
–150
15
is
0 0
0 15 30 45 60 75 Y (mm) 90 105 120 135 150 40,000 35,000 30,000 25,000 20,000 15,000 10,000 5000 dispersion
150 Count the
135 150
120 100
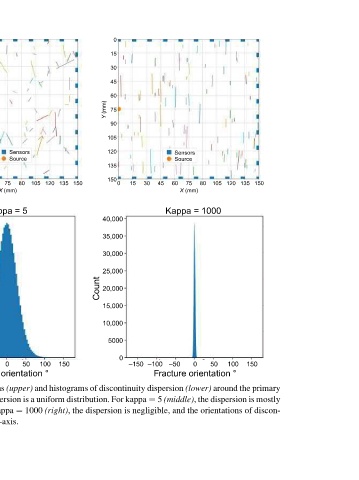
105 kappa ¼ 1000 (right),
Sensors Source 80 50
75 X (mm) Kappa = 5 0 Fracture orientation ° Representative materials containing discontinuities of various dispersions (upper) and histograms of discontinuity dispersion (lower) around the primary y-axis.
60 orientation parallel to y-axis. For kappa ¼ 0 (left), the dispersion is large, and the dispersion is a uniform distribution. For kappa ¼ 5 (middle), the dispersion is mostly to
45 –50 For
–100 parallel
30
–150 of discontinuity.
15
0
50,000 40,000 30,000 20,000 10,000
15 30 45 60 75 90 105 120 135 150 0
0 orientation
Y (mm)
orientation primary
Count
150
135 150 the
120 100 primary to
105 and
80 50 other
Sensors Source 75 X (mm) Kappa = 0 0 Fracture orientation ° around the each
60
45 –50 degrees to
30 –100 parallel
15 50
–150 and
0 almost
15 30 45 60 75 90 105 120 135 150 0
0
10,000 8000 6000 4000 2000 50 are
FIG. 9.22 between tinuity
Y (mm)
Count