
Page 315 - Machine Learning for Subsurface Characterization
P. 315
276 Machine learning for subsurface characterization
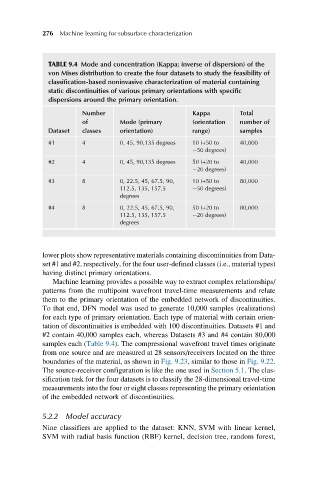
TABLE 9.4 Mode and concentration (Kappa; inverse of dispersion) of the
von Mises distribution to create the four datasets to study the feasibility of
classification-based noninvasive characterization of material containing
static discontinuities of various primary orientations with specific
dispersions around the primary orientation.
Number Kappa Total
of Mode (primary (orientation number of
Dataset classes orientation) range) samples
#1 4 0, 45, 90,135 degrees 10 (+50 to 40,000
50 degrees)
#2 4 0, 45, 90,135 degrees 50 (+20 to 40,000
20 degrees)
#3 8 0, 22.5, 45, 67.5, 90, 10 (+50 to 80,000
112.5, 135, 157.5 50 degrees)
degrees
#4 8 0, 22.5, 45, 67.5, 90, 50 (+20 to 80,000
112.5, 135, 157.5 20 degrees)
degrees
lower plots show representative materials containing discontinuities from Data-
set #1 and #2, respectively, for the four user-defined classes (i.e., material types)
having distinct primary orientations.
Machine learning provides a possible way to extract complex relationships/
patterns from the multipoint wavefront travel-time measurements and relate
them to the primary orientation of the embedded network of discontinuities.
To that end, DFN model was used to generate 10,000 samples (realizations)
for each type of primary orientation. Each type of material with certain orien-
tation of discontinuities is embedded with 100 discontinuities. Datasets #1 and
#2 contain 40,000 samples each, whereas Datasets #3 and #4 contain 80,000
samples each (Table 9.4). The compressional wavefront travel times originate
from one source and are measured at 28 sensors/receivers located on the three
boundaries of the material, as shown in Fig. 9.23, similar to those in Fig. 9.22.
The source-receiver configuration is like the one used in Section 5.1. The clas-
sification task for the four datasets is to classify the 28-dimensional travel-time
measurements into the four or eight classes representing the primary orientation
of the embedded network of discontinuities.
5.2.2 Model accuracy
Nine classifiers are applied to the dataset: KNN, SVM with linear kernel,
SVM with radial basis function (RBF) kernel, decision tree, random forest,