
Page 314 - Machine Learning for Subsurface Characterization
P. 314
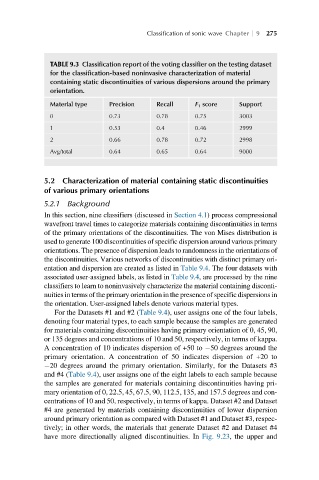
Classification of sonic wave Chapter  9 275


               TABLE 9.3 Classification report of the voting classifier on the testing dataset
               for the classification-based noninvasive characterization of material
               containing static discontinuities of various dispersions around the primary
               orientation.
               Material type   Precision   Recall     F 1 score   Support
               0               0.73        0.78       0.75        3003
               1               0.53        0.4        0.46        2999
               2               0.66        0.78       0.72        2998
               Avg/total       0.64        0.65       0.64        9000


             5.2 Characterization of material containing static discontinuities
             of various primary orientations
             5.2.1 Background
             In this section, nine classifiers (discussed in Section 4.1) process compressional
             wavefront travel times to categorize materials containing discontinuities in terms
             of the primary orientations of the discontinuities. The von Mises distribution is
             used to generate 100 discontinuities of specific dispersion around various primary
             orientations. The presence of dispersion leads to randomness in the orientations of
             the discontinuities. Various networks of discontinuities with distinct primary ori-
             entation and dispersion are created as listed in Table 9.4. The four datasets with
             associated user-assigned labels, as listed in Table 9.4, are processed by the nine
             classifiers to learn to noninvasively characterize the material containing disconti-
             nuities in terms of the primary orientation in the presence of specific dispersions in
             the orientation. User-assigned labels denote various material types.
                For the Datasets #1 and #2 (Table 9.4), user assigns one of the four labels,
             denoting four material types, to each sample because the samples are generated
             for materials containing discontinuities having primary orientation of 0, 45, 90,
             or 135 degrees and concentrations of 10 and 50, respectively, in terms of kappa.
             A concentration of 10 indicates dispersion of +50 to  50 degrees around the
             primary orientation. A concentration of 50 indicates dispersion of +20 to
              20 degrees around the primary orientation. Similarly, for the Datasets #3
             and #4 (Table 9.4), user assigns one of the eight labels to each sample because
             the samples are generated for materials containing discontinuities having pri-
             mary orientation of 0, 22.5, 45, 67.5, 90, 112.5, 135, and 157.5 degrees and con-
             centrations of 10 and 50, respectively, in terms of kappa. Dataset #2 and Dataset
             #4 are generated by materials containing discontinuities of lower dispersion
             around primary orientation as compared with Dataset #1 and Dataset #3, respec-
             tively; in other words, the materials that generate Dataset #2 and Dataset #4
             have more directionally aligned discontinuities. In Fig. 9.23, the upper and