
Page 315 - Machinery Component Maintenance
P. 315
Balancing of Machinery Components 297
Principal Axis
------ 4 if
Inertia
-
\Shaft Axis
I
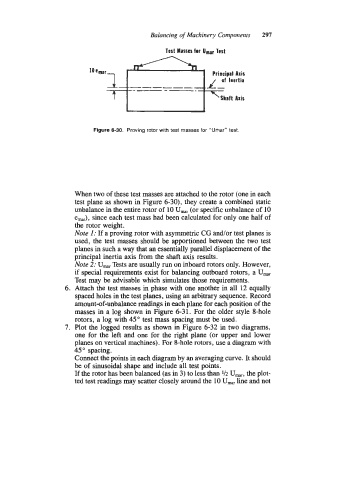
Figure 6-30. Proving rotor with test masses for “Umar” test.
When two of these test masses are attached to the rotor (one in each
test plane as shown in Figure 6-30), they create a combined static
unbalance in the entire rotor of 10 U,, (or specific unbalance of 10
emr), since each test mass had been calculated for only one half of
the rotor weight.
Note I: If a proving rotor with asymmetric CG and/or test planes is
used, the test masses should be apportioned between the two test
planes in such a way that an essentially parallel displacement of the
principal inertia axis from the shaft axis results.
Note 2: U, Tests are usually run on inboard rotors only. However,
if special requirements exist for balancing outboard rotors, a U,,,
Test may be advisable which simulates those requirements.
6. Attach the test masses in phase with one another in all 12 equally
spaced holes in the test planes, using an arbitrary sequence. Record
amount-of-unbalance readings in each plane for each position of the
masses in a log shown in Figure 6-31. For the older style 8-hole
rotors, a log with 45” test mass spacing must be used.
7. Plot the logged results as shown in Figure 6-32 in two diagrams,
one for the left and one for the right plane (or upper and lower
planes on vertical machines). For %hole rotors, use a diagram with
45” spacing.
Connect the points in each diagram by an averaging curve. It should
be of sinusoidal shape and include all test points.
If the rotor has been balanced (as in 3) to less than 1/z U,,, the plot-
ted test readings may scatter closely around the 10 U,,, line and not