Page 316 - Machinery Component Maintenance
P. 316

298    Machinery  Component Maintenance and Repair

                          Angle  of Teat  Maas   0'   30'   60"  90'   120'  150'  180'  210"  240'  270"  300'  330

                                   Left  Plane
                        Amount  of   (Lower  Plane*)
                        Unbalance
                        Readings
                                   Right  Piane
                                   (Upper  Plane*)
                     c


                                           Figure 6-31.  Log for "Umar"  test.


                                                            fl                     Achievable
                                                                  11.2  x  Claimed  Mini-
                         I                                             Raoidul  Unbalance
                                                                  10 x  Claimed  Minimum Achievable
                     #4
                     U                                                Reoidual  Unbalance
                     -0
                     ue
                     w-4
                     -40
                     e0
                     us(                                          8.8  x  Claimed  Minimum  Achievable
                     a4
                     -40               Arithmetic  Mean                Rooidual  Unbolance
                     9ue
                     v1-4  *         c
                                    Angle  of Teot  Ikoo
                     *  Equal  to  ten   times  the  indicator  movement  corresponding  to  the  claimed  minimum
                     achievable  residual  unbalance.

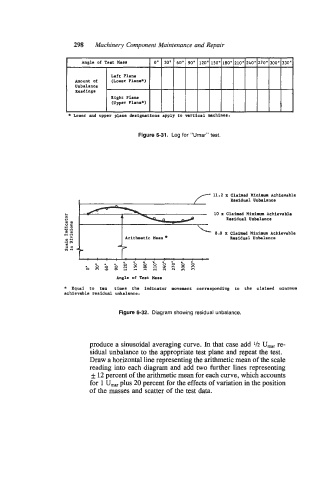
                                     Figure 6-32.  Diagram showing residual unbalance.


                            produce a sinusoidal averaging curve. In that case add  112  U,,   re-
                            sidual unbalance to the appropriate test plane and repeat the test.
                            Draw a horizontal line representing the arithmetic mean of the scale
                            reading into each diagram and add two further lines representing
                             f 12 percent of the arithmetic mean for each curve, which accounts
                            for 1 Umr plus 20 percent for the effects of variation in the position
                            of the masses and scatter of the test data.
   311   312   313   314   315   316   317   318   319   320   321