
Page 149 - Macromolecular Crystallography
P. 149
138 MACROMOLECULAR CRYS TALLOGRAPHY
phasing, the direct-methods procedures are robust, but Trial 6 is not. Thus, the results of the peak com-
and the occupancy refinement can detect success- parison agree with this conclusion and confirm the
fully a large percentage of false sites. site choices based on the occupancy refinement.
Peaks consistently occurring in several indepen-
dent trial solutions are the most likely to correspond
to real atomic sites. Thus, while working under con- 9.6 Determining the proper
ditions (such as the BnP manual mode) where more enantiomorph
than one solution may be present, additional infor-
mation regarding which sites are likely to be correct Even if anomalous dispersion data are involved in
can be obtained by comparing the peaks from dif- the substructure determination process, it is the
ferent trials. The program NANTMRF (Smith, 2002), magnitude of the anomalous differences that are
which takes into account the fact that different solu- used, and the substructures of the biologically occur-
tions may have different origins or enantiomorphs ring macromolecule and its enantiomer are both
and then finds the best overall match between two consistent with the data. The probability that the
sets of peak positions, is available within the BnP substructure obtained by direct methods can be
package and makes it easy to do the comparison. developed into a protein model with L-amino acids
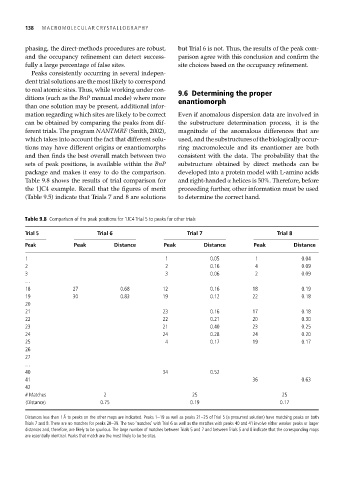
Table 9.8 shows the results of trial comparison for and right-handed α helices is 50%. Therefore, before
the 1JC4 example. Recall that the figures of merit proceeding further, other information must be used
(Table 9.5) indicate that Trials 7 and 8 are solutions to determine the correct hand.
Table 9.8 Comparison of the peak positions for 1JC4 Trial 5 to peaks for other trials
Trial 5 Trial 6 Trial 7 Trial 8
Peak Peak Distance Peak Distance Peak Distance
1 1 0.05 1 0.04
2 2 0.16 4 0.09
3 3 0.06 2 0.09
…
18 27 0.68 12 0.16 18 0.19
19 30 0.83 19 0.12 22 0.18
20
21 23 0.16 17 0.18
22 22 0.21 20 0.30
23 21 0.40 23 0.25
24 24 0.28 24 0.20
25 4 0.17 19 0.17
26
27
…
40 34 0.52
41 36 0.63
42
# Matches 2 25 25
Distance 0.75 0.19 0.17
Distances less than 1 Å to peaks on the other maps are indicated. Peaks 1–19 as well as peaks 21–25 of Trial 5 (a presumed solution) have matching peaks on both
Trials 7 and 8. There are no matches for peaks 28–39. The two ‘matches’ with Trial 6 as well as the matches with peaks 40 and 41 involve either weaker peaks or larger
distances and, therefore, are likely to be spurious. The large number of matches between Trials 5 and 7 and between Trials 5 and 8 indicate that the corresponding maps
are essentially identical. Peaks that match are the most likely to be Se sites.