
Page 148 - Macromolecular Crystallography
P. 148
APPLICATION OF DIRECT METHODS 137
Table 9.5 Figures of merit for Trials 1–10 in the 1JC4 example some cases this simple guideline is adequate. Alter-
sorted in increasing order according to the value of R MIN natively, a conservative approach is to accept the
0.8N to 0.9N top peaks.
Trial R MIN R CRYST CC
Whether working in manual or automatic mode,
7 0.174 0.27 0.42 occupancy refinement against one of the isomor-
8 0.174 0.25 0.44 phous, anomalous, or dispersive difference data sets
5 0.177 0.27 0.45 isagoodwaytodetectspurioussites. Theoccupancy
4 0.265 0.39 0.38 of such sites will typically fall to very low values,
3 0.275 0.38 0.39 and it has been found that, when refined against
10 0.286 0.42 0.39 peak-wavelength (largest f ) anomalous differences,
6 0.295 0.40 0.35 an occupancy cut-off of 0.2 distinguishes true sites
9 0.297 0.40 0.30 from false sites and, in fact, most false sites refine to
2 0.306 0.40 0.34
1 0.309 0.41 0.30 occupancies less than 0.05. This refinement is very
rapid and has the advantage of being hand insensi-
Trials 5, 7, and 8 are solutions. Note the pronounced differences in figure-of- tive. Thus, it need be carried out only once prior to
merit values between Trials 5 and 4. enantiomorph determination (see Section 9.6).
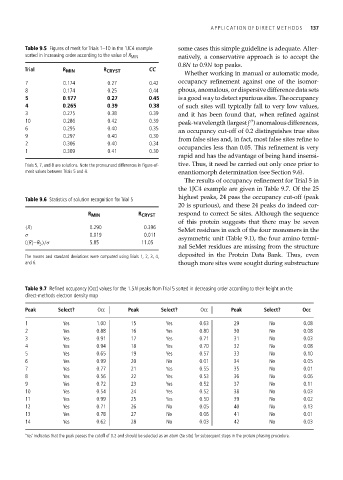
The results of occupancy refinement for Trial 5 in
the 1JC4 example are given in Table 9.7. Of the 25
Table 9.6 Statistics of solution recognition for Trial 5 highest peaks, 24 pass the occupancy cut-off (peak
20 is spurious), and these 24 peaks do indeed cor-
R MIN R CRYST respond to correct Se sites. Although the sequence
of this protein suggests that there may be seven
R 0.290 0.396
SeMet residues in each of the four monomers in the
σ 0.019 0.011
asymmetric unit (Table 9.1), the four amino termi-
( R –R 5 )/σ 5.85 11.05
nal SeMet residues are missing from the structure
The means and standard deviations were computed using Trials 1, 2, 3, 4, deposited in the Protein Data Bank. Thus, even
and 6. though more sites were sought during substructure
Table 9.7 Refined occupancy (Occ) values for the 1.5N peaks from Trial 5 sorted in decreasing order according to their height on the
direct-methods electron density map
Peak Select? Occ Peak Select? Occ Peak Select? Occ
1 Yes 1.00 15 Yes 0.63 29 No 0.08
2 Yes 0.88 16 Yes 0.80 30 No 0.08
3 Yes 0.91 17 Yes 0.71 31 No 0.03
4 Yes 0.94 18 Yes 0.70 32 No 0.08
5 Yes 0.65 19 Yes 0.57 33 No 0.10
6 Yes 0.99 20 No 0.01 34 No 0.05
7 Yes 0.77 21 Yes 0.55 35 No 0.01
8 Yes 0.56 22 Yes 0.53 36 No 0.06
9 Yes 0.72 23 Yes 0.52 37 No 0.11
10 Yes 0.54 24 Yes 0.52 38 No 0.03
11 Yes 0.99 25 Yes 0.50 39 No 0.02
12 Yes 0.71 26 No 0.05 40 No 0.13
13 Yes 0.78 27 No 0.06 41 No 0.01
14 Yes 0.62 28 No 0.03 42 No 0.03
‘Yes’ indicates that the peak passes the cutoff of 0.2 and should be selected as an atom (Se site) for subsequent steps in the protein phasing procedure.