
Page 147 - Macromolecular Crystallography
P. 147
136 MACROMOLECULAR CRYS TALLOGRAPHY
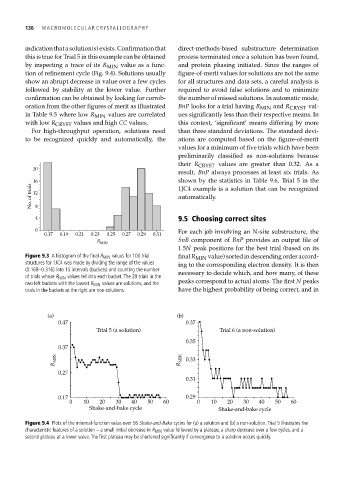
indicationthatasolution(s)exists. Confirmationthat direct-methods-based substructure determination
this is true for Trial 5 in this example can be obtained process terminated once a solution has been found,
by inspecting a trace of its R MIN value as a func- and protein phasing initiated. Since the ranges of
tion of refinement cycle (Fig. 9.4). Solutions usually figure-of-merit values for solutions are not the same
show an abrupt decrease in value over a few cycles for all structures and data sets, a careful analysis is
followed by stability at the lower value. Further required to avoid false solutions and to minimize
confirmation can be obtained by looking for corrob- the number of missed solutions. In automatic mode,
oration from the other figures of merit as illustrated BnP looks for a trial having R MIN and R CRYST val-
in Table 9.5 where low R MIN values are correlated ues significantly less than their respective means. In
with low R CRYST values and high CC values. this context, ‘significant’ means differing by more
For high-throughput operation, solutions need than three standard deviations. The standard devi-
to be recognized quickly and automatically, the ations are computed based on the figure-of-merit
values for a minimum of five trials which have been
preliminarily classified as non-solutions because
their R CRYST values are greater than 0.32. As a
20
result, BnP always processes at least six trials. As
16 shown by the statistics in Table 9.6, Trial 5 in the
No. of trials 12 8 1JC4 example is a solution that can be recognized
automatically.
4 9.5 Choosing correct sites
0 For each job involving an N-site substructure, the
0.17 0.19 0.21 0.23 0.25 0.27 0.29 0.31
SnB component of BnP provides an output file of
R MIN
1.5N peak positions for the best trial (based on its
Figure 9.3 A histogram of the final R MIN values for 100 trial final R MIN value) sorted in descending order accord-
structures for 1JC4 was made by dividing the range of the values ing to the corresponding electron density. It is then
(0.168–0.316) into 15 intervals (buckets) and counting the number necessary to decide which, and how many, of these
of trials whose R MIN values fell into each bucket. The 29 trials in the
two left buckets with the lowest R MIN values are solutions, and the peaks correspond to actual atoms. The first N peaks
trials in the buckets at the right are non-solutions. have the highest probability of being correct, and in
(a) (b)
0.47 0.37
Trial 5 (a solution) Trial 6 (a non-solution)
0.35
0.37
R MIN R MIN 0.33
0.27
0.31
0.17 0.29
0 10 20 30 40 50 60 0 10 20 30 40 50 60
Shake-and-bake cycle Shake-and-bake cycle
Figure 9.4 Plots of the minimal-function value over 56 Shake-and-Bake cycles for (a) a solution and (b) a non-solution. Trial 5 illustrates the
characteristic features of a solution – a small initial decrease in R MIN value followed by a plateau, a sharp decrease over a few cycles, and a
second plateau at a lower value. The first plateau may be shortened significantly if convergence to a solution occurs quickly.