
Page 150 - Macromolecular Crystallography
P. 150
APPLICATION OF DIRECT METHODS 139
In order to choose the enantiomorph, sets of 9.7 From substructure to protein
protein phases must be computed from the set of
Once the proper enantiomorph has been found, the
heavy-atom sites found by direct methods and vali-
substructure determination is complete, and the first
dated by occupancy refinement as well as the set of
of the two stages of protein phasing – the one in
sites related to the first set by inversion. Electron-
which direct methods plays a role – is finished. The
density maps must be generated for both sets of
second stage involves substructure/protein phase
phases and examined for the presence of biologically
refinement, includingthedeterminationofoptimum
correct stereochemistry. If no anomalous dispersion
values for scaling, positional, and thermal param-
data are available, this is the only option. However,
eters as well as expected lack-of-closure estimates
if anomalous scattering measurements are included
and protein phases. Next, solvent flattening can be
when the maps are computed, it is possible to use
used to bring about further phase improvement. In
other criteria to select the enantiomorph automati-
automated programs such as BnP, these steps can be
cally. For example, in BnP protein-solvent envelope
combined with the preceding substructure determi-
masks are created for each map using a protein–
nation, and the entire process run as a single job in
solvent boundary determination algorithm (Wang,
favourable cases. The resulting protein phases are
1985), and then the standard deviations of the elec-
then available for export to graphics programs such
tron densities in the protein and solvent regions are
as O (Jones et al., 1991) for manual examination of
computed as well as the ratio σ(protein)/σ(solvent).
protein models or to programs such as ARPwARP
This ratio should be higher for the correct enan-
(Morris et al., 2003) and RESOLVE (Terwilliger, 2003)
tiomorph since atomic sites and gaps between chains
for automated chain tracing.
within the protein region are expected to show large
variations whereas solvent regions should be rel-
atively flat with little variation. In practice, this Acknowledgment
ratio is a robust discriminator even when challenged
The preparation of this chapter was supported by
deliberately by solutions having both missing and
NIH grant EB002057.
false sites, and prior substructure or phase refine-
ment is not a requirement (Weeks et al., 2002). The
results of applying this enantiomorph determina- References
tion criterion to the 1JC4 example are shown in
Table 9.9. It should be noted that the standard devia- Adams, P. D., Gopal, K., Grosse-Kunstleve, R. W., Hung,
L.-W., Ioerger, T. R., McCoy, A. J., et al. (2004). Recent
tion ratio defined here is similar to, but not identical
developments in the PHENIX software for automated
to, criteria used in the programs SOLVE (Terwilliger
crystallographic structure determination. J. Synchrotron
and Berendzen, 1999) and SHELXE (Sheldrick,
Rad. 11, 53–55.
2002). Baggio, R., Woolfson, M. M., Declercq, J. P., and
Germain, G. (1978). On the application of phase relation-
ships to complex structures. XVI. A random approach to
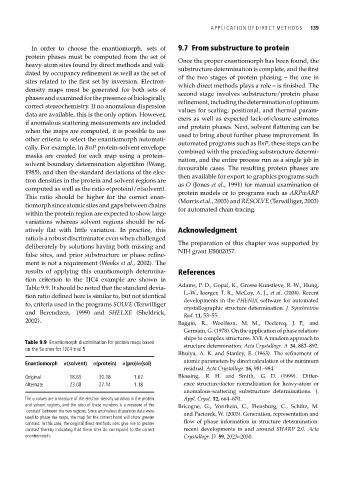
Table 9.9 Enantiomorph discrimination for protein maps based
structure determination. Acta Crystallogr. A 34, 883–892.
on the Se sites for 1JC4 trial 5
Bhuiya, A. K. and Stanley, E. (1963). The refinement of
atomic parameters by direct calculation of the minimum
Enantiomorph σ(solvent) σ(protein) σ(pro)/σ(sol)
residual. Acta Crystallogr. 16, 981–984.
Original 18.65 30.18 1.62 Blessing, R. H. and Smith, G. D. (1999). Differ-
Alternate 23.08 27.14 1.18 ence structure-factor normalization for heavy-atom or
anomalous-scattering substructure determinations. J.
The σ values are a measure of the electron-density variation in the protein Appl. Cryst. 32, 664–670.
and solvent regions, and the ratio of these numbers is a measure of the Bricogne, G., Vonrhein, C., Flensburg, C., Schiltz, M.
‘contrast’ between the two regions. Since anomalous dispersion data were and Paciorek, W. (2003). Generation, representation and
used to phase the maps, the map for the correct hand will show greater
contrast. In this case, the original direct-methods sites give rise to greater flow of phase information in structure determination:
contrast thereby indicating that these sites do correspond to the correct recent developments in and around SHARP 2.0. Acta
enantiomorph. Crystallogr. D 59, 2023–2030.