
Page 82 - Manufacturing Engineering and Technology - Kalpakjian, Serope : Schmid, Steven R.
P. 82
Section 2.2 Tension
situation: A specimen 50 mm in height is compressed between flat platens to a final
height of zero; in other Words, We have deformed the specimen infinitely. According
to their definitions, the engineering strain that the specimen undergoes is
(0 - 50)/50 = - 1, but the true strain is -OO. Note that the answer will be the same
regardless of the original height of the specimen. Clearly, then, true strain describes
the extent of deformation correctly, since the deformation is indeed infinite.
2.2.4 Construction of Stress-Strain Curves
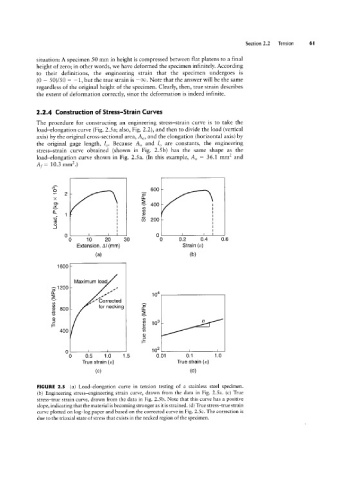
The procedure for constructing an engineering stress-strain curve is to take the
load-elongation curve (Fig. 2.5 a; also, Fig. 2.2), and then to divide the load (vertical
axis) by the original cross-sectional area, AO, and the elongation (horizontal axis) by
the original gage length, IO. Because AO and lo are constants, the engineering
stress-strain curve obtained (shown in Fig. 2.5b) has the same shape as the
load-elongation curve shown in Fig. 2.5a. (In this example, AO = 36.1 mml and
A/1= 10.3 mml.)
°¢ 600
S2 2 E?
><
Q* § 400
§
‘L_ 1
Q 5 200
O
_I
0 0
0 10 20 30 0 0.2 0.4 0.6
Extension, A/ (mm) Strain (S)
(G) (b)
1600
Maximum load
§`l2OO - l, 4
E ,,’ I
I /' Corrected A
Q 800 _ for necking g
E
25
‘U rn
400 T5
G.)
|- E
O 102
0 0.5 1.0 1.5 0.01 0.1 1.0
True strain (e) True strain (S)
(C) (G)
FIGURE 2.5 (a) Load-elongation curve in tension testing of a stainless steel specimen.
(b) Engineering stress-engineering strain curve, drawn from the data in Fig. 2.5a. (c) True
stress-true strain curve, drawn from the data in Fig. 2.5 b. Note that this curve has a positive
slope, indicating that the material is becoming stronger as it is strained. (d) True stress-true strain
curve plotted on log-log paper and based on the corrected curve in Fig. 2.5c. The correction is
due to the triaxial state of stress that exists in the necked region of the specimen.