
Page 79 - Manufacturing Engineering and Technology - Kalpakjian, Serope : Schmid, Steven R.
P. 79
58 Chapter 2 Mechanical Behavior, Testing, and Manufacturing Properties of Materials
to ASTM specifications; various other specifications
+EIastic->:<--Plastic->} are also available from corresponding organizations
Stress, fr = Q) ‘
around the world.
Ultimate tensiIe_______i_____ Typically, the specimen has an original gage
strength (UTS)
length, lo, generally 50 mm , and a cross-sectional area,
Yield stress (Y)- ------ AO, usually with a diameter of 12.5 mm It is mounted
_
in the jaws of a tension-testing machine equipped with
/ Uniform ->l+Necking Fracture
I/ elongation various accessories and controls so that the specimen
can be tested at different temperatures and rates of de-
/ formation.
/
/
/
/
/ 2.2.l Stress-Strain Curves
:ig > A typical deformation sequence in a tension test is shown
+I I+
Offset Strain, e /O
in Fig. 2.1b. When the load is first applied, the specimen
elongates in proportion to the load, called linear elastic
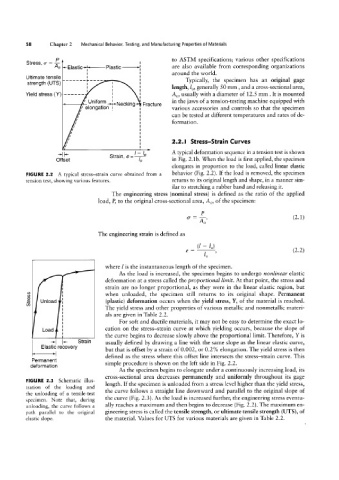
FIGURE 2.2 A typical stress-strain curve obtained from a behavior (Fig. 2.2). If the load is removed, the specimen
tension test, showing various features. returns to its original length and shape, in a manner sim-
ilar to stretching a rubber band and releasing it.
The engineering stress (nominal stress) is defined as the ratio of the applied
load, R to the original cross-sectional area, AO, of the specimen:
P
if = Z; (2.1)
The engineering strain is defined as
e =% (2.2)
1- 1,
where l is the instantaneous length of the specimen.
As the load is increased, the specimen begins to undergo nonlinear elastic
deformation at a stress called the proportional limit. At that point, the stress and
strain are no longer proportional, as they were in the linear elastic region, but
when unloaded, the specimen still returns to its original shape. Permanent
(0
3
b UI1lOad (plastic) deformation occurs when the yield stress, Y, of the material is reached.
CD
The yield stress and other properties of various metallic and nonmetallic materi-
als are given in Table 2.2.
For soft and ductile materials, it may not be easy to determine the exact lo-
Load cation on the stress-strain curve at which yielding occurs, because the slope of
the curve begins to decrease slowly above the proportional limit. Therefore, Y is
->| |<- Strain usually defined by drawing a line with the same slope as the linear elastic curve,
Elastic recovery
wld but that is offset by a strain of 0.002, or 0.2% elongation. The yield stress is then
Permanent defined as the stress where this offset line intersects the stress-strain curve. This
deformation simple procedure is shown on the left side in Fig. 2.2.
As the specimen begins to elongate under a continuously increasing load, its
cross-sectional area decreases permanently and uniformly throughout its gage
FIGURE 2.3 Schematic illus-
length. If the specimen is unloaded from a stress level higher than the yield stress,
tration of the loading and
the unloading of a tensile-test the curve follows a straight line downward and parallel to the original slope of
specimen. Note that, during the curve (Fig. 2.3). As the load is increased further, the engineering stress eventu-
ally reaches a maximum and then begins to decrease (Fig. 2.2). The maximum en-
unloading, the curve follows a
path parallel to the original gineering stress is called the tensile strength, or ultimate tensile strength (UTS), of
elastic slope. the material. Values for UTS for various materials are given in Table 2.2.