
Page 83 - Manufacturing Engineering and Technology - Kalpakjian, Serope : Schmid, Steven R.
P. 83
Chapter 2 Mechanical Behavior. Testing, and Manufacturing Properties of Materials
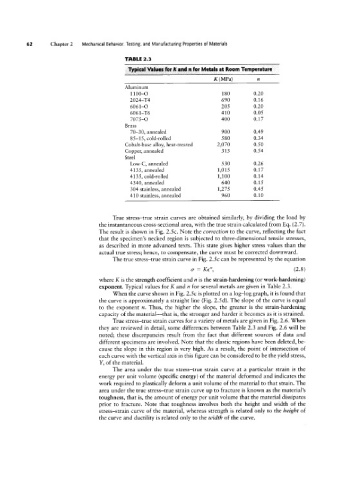
TABLE 2.3
Typical Values for K and n for Metals at Room Temperature
K (MPa) n
Aluminum
1 100-O 1 80 0.20
2024-T4 690 0.16
606 1-O 205 0.20
6061-T6 410 0.05
7075-O 400 0.1 7
Brass
70-30, annealed 900 0.49
85-15, cold-rolled 580 0.34
Cobalt-base alloy, heat-treated 2,070 0.50
Copper, annealed 315 0.54
Steel
Low-C, annealed 530 0.26
4135, annealed 1,015 0.17
4135, cold-rolled 1,100 0.14
4340, annealed 640 0.15
304 stainless, annealed 1,275 0.45
410 stainless, annealed 960 0.10
True stress-true strain curves are obtained similarly, by dividing the load by
the instantaneous cross-sectional area, with the true strain calculated from Eq. (2.7).
The result is shown in Fig. 2.5c. Note the correction to the curve, reflecting the fact
that the specimen’s necked region is subjected to three-dimensional tensile stresses,
as described in more advanced texts. This state gives higher stress values than the
actual true stress; hence, to compensate, the curve must be corrected downward.
The true stress-true strain curve in Fig. 2.5c can be represented by the equation
0' = Ke", (2.8)
where K is the strength coefficient and n is the strain-hardening (or work-hardening)
exponent. Typical values for K and n for several metals are given in Table 2.3.
When the curve shown in Fig. 2.5c is plotted on a log-log graph, it is found that
the curve is approximately a straight line (Fig. 2.5 d). The slope of the curve is equal
to the exponent n. Thus, the higher the slope, the greater is the strain-hardening
capacity of the material--that is, the stronger and harder it becomes as it is strained.
True stress-true strain curves for a variety of metals are given in Fig. 2.6. When
they are reviewed in detail, some differences between Table 2.3 and Fig. 2.6 will be
noted; these discrepancies result from the fact that different sources of data and
different specimens are involved. Note that the elastic regions have been deleted, be-
cause the slope in this region is very high. As a result, the point of intersection of
each curve with the vertical axis in this figure can be considered to be the yield stress,
Y, of the material.
The area under the true stress-true strain curve at a particular strain is the
energy per unit volume (specific energy) of the material deformed and indicates the
work required to plastically deform a unit volume of the material to that strain. The
area under the true stress-true strain curve up to fracture is known as the material’s
toughness, that is, the amount of energy per unit volume that the material dissipates
prior to fracture. Note that toughness involves both the height and width of the
stress-strain curve of the material, whereas strength is related only to the height of
the curve and ductility is related only to the width of the curve.