
Page 84 - Manufacturing Engineering and Technology - Kalpakjian, Serope : Schmid, Steven R.
P. 84
Section 2.2 Tension
1200 L 304 Stainless steel
70-30 Brass, as received
1000 - 8650 Steel
1112 Steel,
C0|d roned 70-30 Brass, annealed
E5 80° ` 1020 Steel
§ 4130 Steel
CD
g 600 Copper, annealed
gg 2024-T36 AI
I: 400 2024-O Al
, 1100-O AI 4
6061-O Al
200
1100-H14 Al
O
0 0.2 0.4 0.6 0.8 1.0 1.2 1.4 1.6 1.8 2.0
True strain (S)
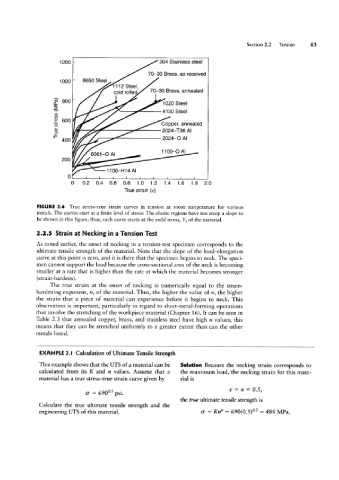
FIGURE 2.6 True stress-true strain curves in tension at room temperature for various
metals. The curves start at a finite level of stress: The elastic regions have too steep a slope to
be shown in this figure; thus, each curve starts at the yield stress, Y, of the material.
2.2.5 Strain at Necking in a Tension Test
As noted earlier, the onset of necking in a tension-test specimen corresponds to the
ultimate tensile strength of the material. Note that the slope of the load-elongation
curve at this point is zero, and it is there that the specimen begins to neck. The speci-
men cannot support the load because the cross-sectional area of the neck is becoming
smaller at a rate that is higher than the rate at which the material becomes stronger
(strain-hardens).
The true strain at the onset of necking is numerically equal to the strain-
hardening exponent, n, of the material. Thus, the higher the value of n, the higher
the strain that a piece of material can experience before it begins to neck. This
observation is important, particularly in regard to sheet-metal-forming operations
that involve the stretching of the workpiece material (Chapter 16). It can be seen in
Table 2.3 that annealed copper, brass, and stainless steel have high n values; this
means that they can be stretched uniformly to a greater extent than can the other
metals listed.
EXAMPLE 2.| Calculation of Ultimate Tensile Strength
This example shows that the UTS of a material can be Solution Because the necking strain corresponds to
calculated from its K and 71 values. Assume that a the maximum load, the necking strain for this mate
material has a true stress-true strain curve given by rial is
6 = n = 0.5
0' = 69005 psi. ’
_
the true ultimate tensile strength is
_ _
Calculate the true ultimate tensile strength and the
' = 488 MPa.
engineering UTS of this material. O' = KH” = 69O(O.5) 0 5