
Page 80 - Manufacturing Engineering and Technology - Kalpakjian, Serope : Schmid, Steven R.
P. 80
Section 2.2 Tension 59
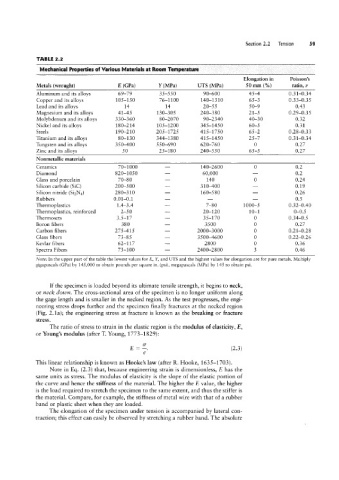
TABLE 2.2
Mechanical Properties of Various Materials at Room Temperature
Elongation in Poisson’s
Metals (wrought) E (GPa) Y (MPa) UTS (MPa) 50 mm (%) ratio, 1/
Aluminum and its alloys 69-79 35-550 90-600 45-4 0.31-0.34
Copper and its alloys 105-150 76-1100 140-1310 65-3 0.33-0.35
Lead and its alloys 14 14 20-55 50-9 0.43
Magnesium and its alloys 41-45 130-305 240-380 21-5 0.29-0.35
Molybdenum and its alloys 330-360 80-2070 90-2340 40-30 0.32
Nickel and its alloys 180-214 105-1200 345-1450 60-5 0.31
Steels 190-210 205-1725 415-1750 65-2 0.28-0.33
Titanium and its alloys 80-130 344-1380 415-1450 25-7 0.31-0.34
Tungsten and its alloys 350-400 550-690 620-760 0 0.27
Zinc and its alloys 50 25-180 240-550 65-5 0.27
Nonrnetallic materials
Ceramics 70-1000 _ 140-2600 0 0.2
Diamond 820-1050 _ 60,000 _ 0.2
Glass and porcelain 70-80 - 140 0 0.24
Silicon carbide (SiC) 200-500 _ 310-400 _ 0.19
Silicon nitride (Si2N4) 280-310 _ 160-580 _ 0.26
Rubbers 0.01-0.1 _ _ _ 0.5
Thermoplastics 1.4-3.4 _ 7-80 1000-5 0.32-0.40
Thermoplastics, reinforced 2-50 _ 20-120 10-1 0-0.5
Thermosets 3.5-17 _ 35-170 0 0.34-0.5
Boron fibers 380 - 3500 0 0.27
Carbon fibers 275-415 - 2000-3000 0 0.21-0.28
Glass fibers 73-85 _ 3500-4600 0 0.22-0.26
Kevlar fibers 62-1 17 _ 2800 0 0.36
Spectra Fibers 73-100 _ 2400-2800 3 0.46
Note: In the upper part of the table the lowest values for E, Y, and UTS and the highest values for elongation are for pure metals. Multiply
gigapascals (GPa) by 145,000 to obtain pounds per square in. (psi), megapascals (MPa) by 145 to obtain psi.
If the specimen is loaded beyond its ultimate tensile strength, it begins to neck,
or nec/Q down. The cross-sectional area of the specimen is no longer uniform along
the gage length and is smaller in the necked region. As the test progresses, the engi-
neering stress drops further and the specimen finally fractures at the necked region
(Fig. 2.1a); the engineering stress at fracture is known as the breaking or fracture
stress.
The ratio of stress to strain in the elastic region is the modulus of elasticity, E,
or Young’s modulus (after T. Young, 1773-1829):
1; = (2.3)
This linear relationship is known as Hooke’s law (after R. Hooke, 1635-1703).
Note in Eq. (2.3) that, because engineering strain is dimensionless, E has the
same units as stress. The modulus of elasticity is the slope of the elastic portion of
the curve and hence the stiffness of the material. The higher the E value, the higher
is the load required to stretch the specimen to the same extent, and thus the stiffer is
the material. Compare, for example, the stiffness of metal wire with that of a rubber
band or plastic sheet when they are loaded.
The elongation of the specimen under tension is accompanied by lateral con-
traction; this effect can easily be observed by stretching a rubber band. The absolute