
Page 86 - 04. Subyek Engineering Materials - Manufacturing, Engineering and Technology SI 6th Edition - Serope Kalpakjian, Stephen Schmid (2009)
P. 86
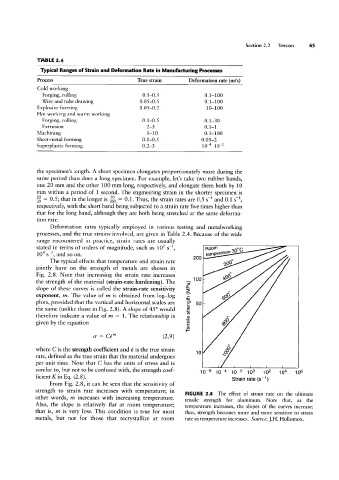
TABLE 2.4
               Typical Ranges of Strain and Deformation Rate in Manufacturing Processes
              Process                            True strain       Deformation rate (m/s)
              Cold working
                Forging, rolling                   0.1-0.5               0.1-100
                Wire and tube drawing             0.05-0.5               0.1-100
              Explosive forming                   0.05-0.2               10-100
              Hot working and warm working
                Forging, rolling                   0.1-0.5               0.1-30
                Extrusion                           2-5                  0.1-1
              Machining                             1-10                 0.1-100
              Sheet-metal forming                  0.1-0.5              0.05-2
              Superplastic forming                 0.2-3                104'-10'2


              the specimen’s length. A short specimen elongates proportionately more during the
              same period than does a long specimen. For example, let’s take two rubber bands,
              one 20 mm and the other 100 mm long, respectively, and elongate them both by 10
              mm within a period of  1 second. The engineering strain in the shorter specimen is
              % = 0.5; that in the longer is % = 0.1. Thus, the strain rates are 0.5 ST1 and 0.1 s`1,
              respectively, with the short band being subjected to a strain rate five times higher than
              that for the long band, although they are both being stretched at the same deforma-
              tion rate.
                   Deformation rates typically employed in various testing and metalworking
              processes, and the true strains involved, are given in Table 2.4. Because of the wide
              range encountered in practice, strain rates are usually
              stated in terms of orders of magnitude, such as 102 s`l,   Room     30°C
              104 ST1, and so on.                                    200 _iempelamre
                  The typical effects that temperature and strain rate  T      200°
              jointly have on the strength of metals are shown in
              Fig. 2.8. Note that increasing the strain rate increases         5967
              the strength of the material (strain-rate hardening). The  1; 100
              slope of these curves is called the strain-rate sensitivity  Q     O
              exponent, m. The value of m is obtained from log-log  fi         69°
              plots, provided that the vertical and horizontal scales are  E’  50 -
              the same (unlike those in Fig. 2.8). A slope of 45° would  2
              therefore indicate a value of m = 1. The relationship is  Q       8
              given by the equation                                            Q9
                                                                  3
                                  rr = Cém                (2.9)
                                                                               §
              where C is the strength coefficient and é is the true strain  10
              rate, defined as the true strain that the material undergoes     "
             per unit time. Note that C has the units of stress and is
              similar to, but not to be confused with, the strength coef-  10'610'410'2100   102   104  105
             ficient K in Eq. (2.8).                                              Strain rate (s")
                  From Fig. 2.8, it can be seen that the sensitivity of
             strength to strain rate increases with temperature; in
                                                                  FIGURE 2.8  The effect of strain rate on the ultimate
             other words, m increases with increasing temperature.
                                                                  tensile  strength  for  aluminum.  Note  that,  as  the
             Also, the slope is relatively flat at room temperature;  temperature increases, the slopes of the curves increase;
             that is, m is very low. This condition is true for most  thus, strength becomes more and more sensitive to strain
             metals, but not for those that recrystallize at room  rate as temperature increases. Source: ].H. Hollomon.