
Page 198 - Marine Structural Design
P. 198
174 Part II Ultimate Strength
0.05
0.04 v; Reddy - steel '*)
m; Reddy - alminium IC)
0.03
'cr
0.02
0.01
0.008
0.006
0.005
0.004
0.003
0.002
0.001 & I I l l I 1
20 30 40 50 60 80 100
Wt
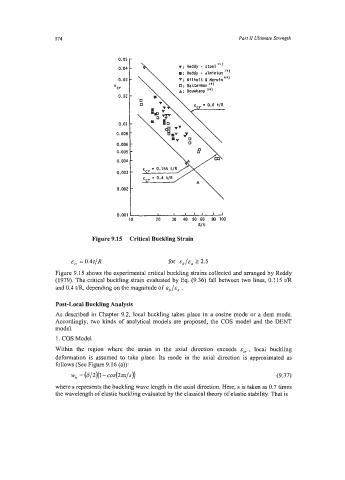
Figure 9.15 Critical Buckling Strain
E, = 0.4tfR for /E, 2 2.5
Figure 9.15 shows the experimental critical buckling strains collected and arranged by Reddy
(1979). The critical buckling strain evaluated by Eq. (9.36) fall between two lines, 0.115 t/R
and 0.4 tlR, depending on the magnitude of E* f E, .
Post-Local Buckling Analysis
As described in Chapter 9.2, local buckling takes place in a cosine mode or a dent mode.
Accordingly, two kinds of analytical models are proposed, the COS model and the DENT
model.
1. COS Model
Within the region where the strain in the axial direction exceeds E, , local buckling
deformation is assumed to take place. Its mode in the axial direction is approximated as
follows (See Figure 9.16 (a)):
Wb = (6/2XI- cos(2m/s)j (9.37)
where s represents the buckling wave length in the axial direction. Here, s is taken as 0.7 times
the wavelength of elastic buckling evaluated by the classical theory of elastic stability. That is