Page 600 - Marine Structural Design
P. 600
576                                                      Part VRbk Assessment


                It has been shown that the time to reach the maximum oil production is very important to the
                final project result. The consolidated IRR analysis is used to demonstrate the use of sensitivity
                factors for this variable. The analysis is for an IRR = 11.3% corresponding to  10% fractile.
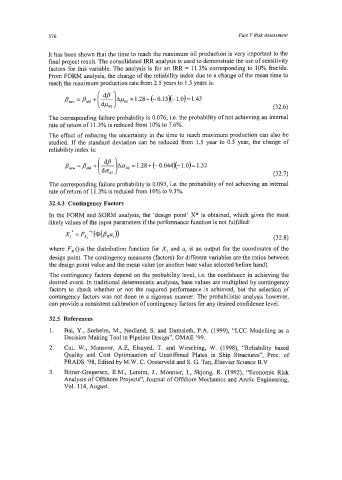
                From FORM analysis, the change of the reliability index due to a change of the mean time to
                reach the maximum production rate from 2.5 years to 1.5 years is:
                              (E2)                                                  (32.6)
                    p,,,  =Pard +  - Ap62 =1.28+(-0.15x-1.0)=1.43


                The corresponding failure probability is 0.076, i.e. the probability of not achieving an internal
                rate of return of 1 1.3% is reduced from 10% to 7.6%.
                The effect of reducing the uncertainty in the time to reach maximum production can also be
                studied. If the standard deviation can be  reduced from  1.5 year to  0.5 year, the change of
                reliability index is:
                               (:2 1
                                     ACT,,
                    pn, =P,,  +  - =1.28+(-0.044~-1.0)=1.32                         (32.7)
                The corresponding failure probability is 0.093, i.e. the probability of not achieving an internal
                rate of return of 11.3% is reduced from 10% to 9.3%.
                32.4.3  Contingency Factors
                In the FORM and SORM analysis, the ‘design point’ X* is obtained, which gives the most
                likely values of the input parameters if the performance function is not fulfilled:

                     Xi’ = Fx,-’(@(,8Raj))
                                                                                    (32.8)
                where F,Ois  the distribution hction for Xi and a, is an output for the coordinates of the
                design point. The contingency measures (factors) for different variables are the ratios between
                the design point value and the mean value (or another base value selected before hand).
                The contingency factors depend on the probability level, i.e. the confidence in achieving the
                desired event. In traditional deterministic analyses, base values are multiplied by contingency
                factors to  check whether or not the required performance is achieved, but  the selection of
                contingency factors was not done in a rigorous manner. The probabilistic analysis however,
                can provide a consistent calibration of contingency factors for any desired confidence level.

                32.5  References
                1.   Bai, Y.,  Smheim, M.,  Nndland, S. and Damsleth, P.A.  (1999), “LCC Modelling as a
                    Decision Making Tool in Pipeline Design”, OMAE ’99.
                2.   Cui,  W.,  Mansour, A.E,  Elsayed,  T.  and  Wirsching,  W.  (1998),  “Reliability based
                    Quality  and  Cost  Optimisation of  Unstiffened  Plates  in  Ship  Structures”, Proc.  of
                    PRADS ’98, Edited by M.W. C. Oosterveld and S. G. Tan, Elsevier Science B.V
                3.   Bitner-Gregersen, E.M.,  Lereim, J.,  Monnier, I.,  Skjong, R.  (1992), “Economic Risk
                    Analysis of Offshore Projects”, Journal of Offshore Mechanics and Arctic Engineering,
                    Vol. 114, August.

