
Page 84 - Marine Structural Design
P. 84
60 Part I Structural Design F’rincipreS
Denoting the long-term based average number of observations of responses in TD by AiD, then
TD = Duration of service, unit of time in years
Tb =Duration of service, unit of time in hours
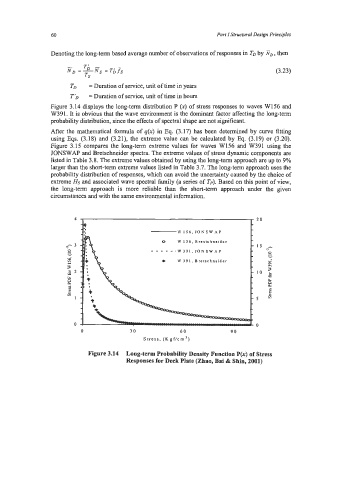
Figure 3.14 displays the long-term distribution P (x) of stress responses to waves W156 and
W391. It is obvious that the wave environment is the dominant factor affecting the long-term
probability distribution, since the effects of spectral shape are not significant.
After the mathematical formula of q(x) in Eq. (3.17) has been determined by curve fitting
using Eqs. (3.18) and (3.21), the extreme value can be calculated by Eq. (3.19) or (3.20).
Figure 3.15 compares the long-term extreme values for waves W156 and W391 using the
JONSWAP and Bretschneider spectra. The extreme values of stress dynamic components are
listed in Table 3.8. The extreme values obtained by using the long-term approach are up to 9%
larger than the short-term extreme values listed in Table 3.7. The long-term approach uses the
probability distribution of responses, which can avoid the uncertainty caused by the choice of
extreme HS and associated wave spectral family (a series of Tp). Based on this point of view,
the long-term approach is more reliable than the short-term approach under the given
circumstances and with the same environmental information.
4 20
W 156, JONSW AP
0 W 156, Brestchneider
_--
- - .W 391, JONSW AP
e W 391, Bretschneider
cs
E
VI
YI
e
Gi
1
0 0
0 30 60 90
Stress, (K gf/cm ’)
Figure 3.14 Long-term Probability Density Function P(x) of Stress
Responses for Deck Plate (Zhao, Bai & Shin, 2001)