
Page 82 - Marine Structural Design
P. 82
58 Part I Structural Design Principles
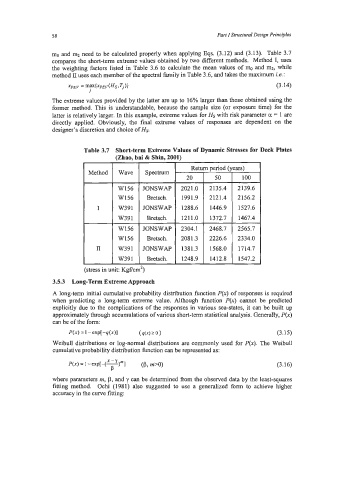
mo and m2 need to be calculated properly when applying Eqs. (3.12) and (3.13). Table 3.7
compares the short-term extreme values obtained by two different methods. Method I, uses
the weighting factors listed in Table 3.6 to calculate the mean values of m,~ and m2, while
method II uses each member of the spectral family in Table 3.6, and takes the maximum i.e. :
XPEY = m+PEY(%q)} (3.14)
J
The extreme values provided by the latter are up to 16% larger than those obtained using the
former method. This is understandable, because the sample size (or exposure time) for the
latter is relatively larger. In this example, extreme values for Hs with risk parameter a = 1 are
directly applied. Obviously, the final extreme values of responses are dependent on the
designer’s discretion and choice of Hs.
Table 3.7 Short-term Extreme Values of Dynamic Stresses for Deck Plates
(Zhao. bai & Shin, 20011
Return period (years)
Method Wave Spectrum
20 50 100
W156 JONSWAP 2021.0 2135.4 2139.6
W156 Bretsch. 1991.9 2121.4 2156.2
I W391 JONSWAP 1288.6 1446.9 1527.6
W391 Bretsch. 1211.0 1372.7 1467.4
W156 JONSWAP 2304.1 2468.7 2565.7
W156 Bretsch. 2081.3 2226.6 2334.0
II W391 JONSWAP 1381.3 1568.0 1714.7
W391 Bretsch. 1248.9 1412.8 1547.2