
Page 80 - Marine Structural Design
P. 80
56 Pa# I Structural Design Principles
(3.11)
where Ts is the time length of wave data, unit of time in hours.
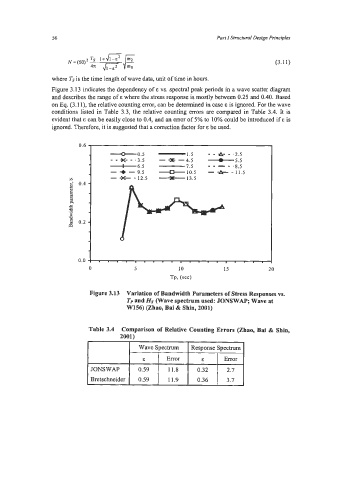
Figure 3.13 indicates the dependency of E vs. spectral peak periods in a wave scatter diagram
and describes the range of E where the stress response is mostly between 0.25 and 0.40. Based
on Eq. (3.1 l), the relative counting error, can be determined in case E is ignored. For the wave
conditions listed in Table 3.3, the relative counting errors are compared in Table 3.4. It is
evident that E can be easily close to 0.4, and an error of 5% to 10% could be introduced if E is
ignored. Therefore, it is suggested that a correction factor for E be used.
-.-
-
-0.5 -1.5 - - A- m2.5
- - x- - -3.5 - -Ye -4.5 -5.5 -
-6.5 7.5 - - - - 8.5
- + - 9.5 -10.5 - - 11.5
z 0.4 - - -X- - 12.5 -13.5
1
a
3
3
fdd 0.2 -
Q
a
0.0
0
Figure 3.13 Variation of Bandwidth Parameters of Stress Responses vs.
Tp and HS (Wave spectrum used: JONSWAP; Wave at
W156) (Zhao, Bai & Shin, 2001)
Table 3.4 Comparison of Relative Counting Errors (Zhao, Bai & Shin,
2001)
JONSWAP
0.36