
Page 77 - Marine Structural Design
P. 77
Chapter 53
sr Bretschneider
x 10 -
*
rn
N
- 8-
%
i"M 61
25:
4-
2-
0
0.0 0.5 1 .o 1.5 2.0
Wave frequency, (rads)
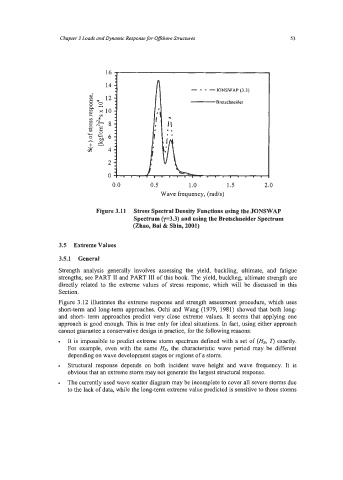
Figure 3.11 Stress Spectral Density Functions using the JONSWAP
Spectrum (~3.3) and using the Bretschneider Spectrum
(Zhao, Bai & Shin, 2001)
3.5 Extreme Values
3.5.1 General
Strength analysis generally involves assessing the yield, buckling, ultimate, and fatigue
strengths, see PART 11 and PART 111 of this book. The yield, buckling, ultimate strength are
directly related to the extreme values of stress response, which will be discussed in this
Section.
Figure 3.12 illustrates the extreme response and strength assessment procedure, which uses
short-term and long-term approaches. Ochi and Wang (1979, 1981) showed that both long-
and short- term approaches predict very close extreme values. It seems that applying one
approach is good enough. This is true only for ideal situations. In fact, using either approach
cannot guarantee a conservative design in practice, for the following reasons:
It is impossible to predict extreme storm spectrum defined with a set of (Hs, r) exactly.
For example, even with the same Hs, the characteristic wave period may be different
depending on wave development stages or regions of a storm.
Structural response depends on both incident wave height and wave frequency. It is
obvious that an extreme storm may not generate the largest structural response.
The currently used wave scatter diagram may be incomplete to cover all severe storms due
to the lack of data, while the long-term extreme value predicted is sensitive to those storms.