
Page 81 - Marine Structural Design
P. 81
Chapter 3 Loads and Dynamic Response for qffshore Structures 57
Using Eq. (3.11), Eqs. (3.9) and (3.10) can be rewritten as:
(3.12)
(3.13)
Xm,,
Eqs. (3.12) and (3.13) are not directly dependent on E.
When applying the short-term approach, a design wave spectrum of the extreme storm
condition is usually combined with a long-term extreme value of HS and T. Ochi’s (1981)
results indicate that the probability density function of (Hs, T) takes a bivariant lognormal
distribution. A commonly used approach is to determine the long-term extreme value of Hs,
and obtain T along with the conditional probability distribution p(qH), or using a simpler
formula between HS and T based on the wave steepness.
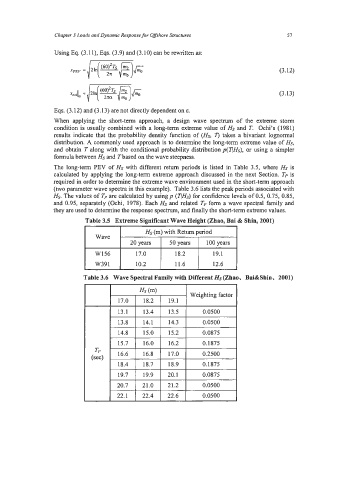
The long-term PEV of Hs with different return periods is listed in Table 3.5, where HS is
calculated by applying the long-term extreme approach discussed in the next Section. Tp is
required in order to determine the extreme wave environment used in the short-term approach
(two parameter wave spectra in this example). Table 3.6 lists the peak periods associated with
Hs. The values of Tp are calculated by usingp (ZlHs) for confidence levels of 0.5, 0.75, 0.85,
and 0.95, separately (Ochi, 1978). Each HS and related Tp form a wave spectral family and
they are used to determine the response spectrum, and finally the short-term extreme values.
Table 3.5 Extreme Significant Wave Height (Zhao, Bai & Shin, 2001)
Hs (m) with Return period
20 years
W391 10.2 11.6 12.6
Wave Spectral Family with Different Hs(Zhao, Bai&Shin, 2001)
Hs (m)
Weighting factor
0.0500
14.3 0.0500
14.8 I 15.0 I 15.2 I 0.0875 I
18.4 18.7 18.9 0.1875
19.7 19.9 20.1 0.0875
20.7 21.0 21.2 0.0500
22.1 22.4 22.6 0.0500