
Page 305 - Marks Calculation for Machine Design
P. 305
P1: Shashi
January 4, 2005
Brown˙C07
Brown.cls
0 15:4 FATIGUE AND DYNAMIC DESIGN Time 287
s max
Stress (s) s s a
m
s a
s min
FIGURE 7.8 Fluctuating loading (negative stresses).
For any of the these three possibilities, the mean stress (σ m ) and the alternating stress
(σ a ) can be related to the maximum stress (σ max ) and the minimum stress (σ min ) by the
following relationships:
σ max + σ min
σ m = (7.19)
2
σ max − σ min
σ a = (7.20)
2
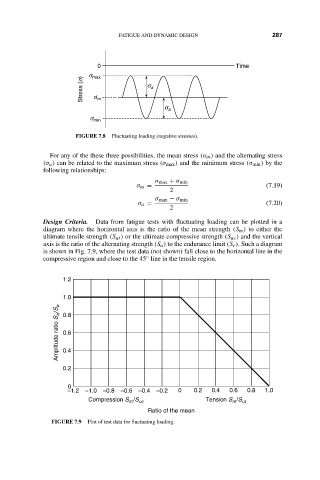
Design Criteria. Data from fatigue tests with fluctuating loading can be plotted in a
diagram where the horizontal axis is the ratio of the mean strength (S m ) to either the
ultimate tensile strength (S ut ) or the ultimate compressive strength (S uc ) and the vertical
axis is the ratio of the alternating strength (S a ) to the endurance limit (S e ). Such a diagram
is shown in Fig. 7.9, where the test data (not shown) fall close to the horizontal line in the
◦
compressive region and close to the 45 line in the tensile region.
1.2
1.0
Amplitude ratio S a /S e 0.8
0.6
0.4
0.2
0
−1.2 −1.0 −0.8 −0.6 −0.4 −0.2 0 0.2 0.4 0.6 0.8 1.0
Compression S /S uc Tension S /S ut
m
m
Ratio of the mean
FIGURE 7.9 Plot of test data for fluctuating loading.