
Page 306 - Marks Calculation for Machine Design
P. 306
P1: Shashi
January 4, 2005
15:4
Brown.cls
Brown˙C07
STRENGTH OF MACHINES
288
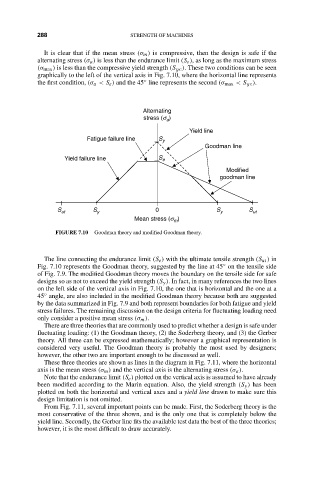
It is clear that if the mean stress (σ m ) is compressive, then the design is safe if the
alternating stress (σ a ) is less than the endurance limit (S e ), as long as the maximum stress
(σ max ) is less than the compressive yield strength (S yc ). These two conditions can be seen
graphically to the left of the vertical axis in Fig. 7.10, where the horizontal line represents
◦
the first condition, (σ a < S e ) and the 45 line represents the second (σ max < S yc ).
Alternating
stress (s )
a
Yield line
Fatigue failure line S y
Goodman line
Yield failure line S e
Modified
goodman line
S ut S y 0 S y S ut
Mean stress (s )
m
FIGURE 7.10 Goodman theory and modified Goodman theory.
The line connecting the endurance limit (S e ) with the ultimate tensile strength (S ut ) in
◦
Fig. 7.10 represents the Goodman theory, suggested by the line at 45 on the tensile side
of Fig. 7.9. The modified Goodman theory moves the boundary on the tensile side for safe
designs so as not to exceed the yield strength (S y ). In fact, in many references the two lines
on the left side of the vertical axis in Fig. 7.10, the one that is horizontal and the one at a
◦
45 angle, are also included in the modified Goodman theory because both are suggested
by the data summarized in Fig. 7.9 and both represent boundaries for both fatigue and yield
stress failures. The remaining discussion on the design criteria for fluctuating loading need
only consider a positive mean stress (σ m ).
There are three theories that are commonly used to predict whether a design is safe under
fluctuating loading: (1) the Goodman theory, (2) the Soderberg theory, and (3) the Gerber
theory. All three can be expressed mathematically; however a graphical representation is
considered very useful. The Goodman theory is probably the most used by designers;
however, the other two are important enough to be discussed as well.
These three theories are shown as lines in the diagram in Fig. 7.11, where the horizontal
axis is the mean stress (σ m ) and the vertical axis is the alternating stress (σ a ).
Note that the endurance limit (S e ) plotted on the vertical axis is assumed to have already
been modified according to the Marin equation. Also, the yield strength (S y ) has been
plotted on both the horizontal and vertical axes and a yield line drawn to make sure this
design limitation is not omitted.
From Fig. 7.11, several important points can be made. First, the Soderberg theory is the
most conservative of the three shown, and is the only one that is completely below the
yield line. Secondly, the Gerber line fits the available test data the best of the three theories;
however, it is the most difficult to draw accurately.