
Page 404 - Marks Calculation for Machine Design
P. 404
P1: Naresh
15:28
January 4, 2005
Brown˙C09
Brown.cls
APPLICATION TO MACHINES
386
Using the Bergstr¨asser factor (K B ) given by Eq. (9.16) in place of the shear-stress
correction factor (K s ), the alternating shear stress (τ a ) is given by Eq. (9.50) as
8F a D
τ a = K B 3 (9.50)
πd
Also from Chap. 7, the Goodman theory for fluctuating torsional loading is applicable
where the factor of safety (n) for a safe design was given by Eq. (7.34) and repeated here
as
τ a τ m 1
+ = (7.34)
S e S us n
where the endurance limit (S e ) is calculated as usual using the Marin formula in Eq. (7.7)
with the load type factor (k c ) equal to (0.577), and the ultimate shear stress (S us ) found
from the relationship in Eq. (7.33), repeated here.
S us = (0.67)S ut (7.33)
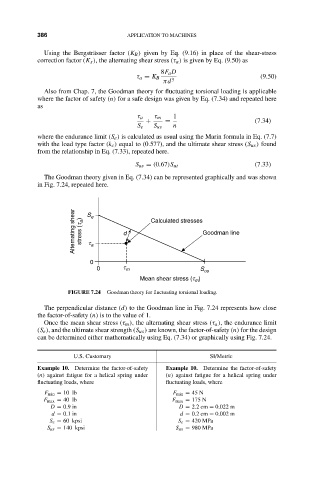
The Goodman theory given in Eq. (7.34) can be represented graphically and was shown
in Fig. 7.24, repeated here.
Alternating shear stress (t a ) S e a d Calculated stresses Goodman line
t
0
0 t m S us
Mean shear stress (t )
m
FIGURE 7.24 Goodman theory for fluctuating torsional loading.
The perpendicular distance (d) to the Goodman line in Fig. 7.24 represents how close
the factor-of-safety (n) is to the value of 1.
Once the mean shear stress (τ m ), the alternating shear stress (τ a ), the endurance limit
(S e ), and the ultimate shear strength (S us ) are known, the factor-of-safety (n) for the design
can be determined either mathematically using Eq. (7.34) or graphically using Fig. 7.24.
U.S. Customary SI/Metric
Example 10. Determine the factor-of-safety Example 10. Determine the factor-of-safety
(n) against fatigue for a helical spring under (n) against fatigue for a helical spring under
fluctuating loads, where fluctuating loads, where
F min = 10 lb F min = 45 N
F max = 40 lb F max = 175 N
D = 0.9 in D = 2.2 cm = 0.022 m
d = 0.1 in d = 0.2 cm = 0.002 m
S e = 60 kpsi S e = 420 MPa
S us = 140 kpsi S us = 980 MPa