
Page 121 - Master Handbook of Acoustics
P. 121
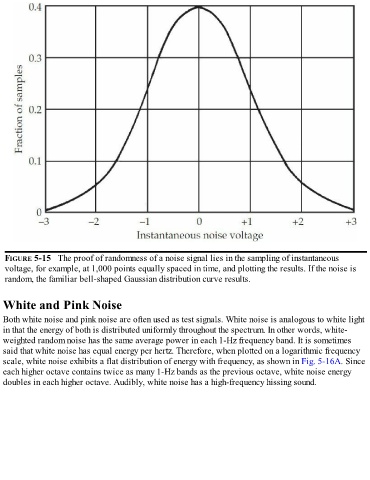
FIGURE 5-15   The proof of randomness of a noise signal lies in the sampling of instantaneous

   voltage, for example, at 1,000 points equally spaced in time, and plotting the results. If the noise is
   random, the familiar bell-shaped Gaussian distribution curve results.


  White and Pink Noise

  Both white noise and pink noise are often used as test signals. White noise is analogous to white light
  in that the energy of both is distributed uniformly throughout the spectrum. In other words, white-

  weighted random noise has the same average power in each 1-Hz frequency band. It is sometimes
  said that white noise has equal energy per hertz. Therefore, when plotted on a logarithmic frequency
  scale, white noise exhibits a flat distribution of energy with frequency, as shown in Fig. 5-16A. Since
  each higher octave contains twice as many 1-Hz bands as the previous octave, white noise energy
  doubles in each higher octave. Audibly, white noise has a high-frequency hissing sound.