
Page 123 - Master Handbook of Acoustics
P. 123
An example of this is the 1/3-octave analyzer, commonly used because its bandwidth follows
reasonably well with the critical bandwidth of the human ear throughout the audible frequency range.
At 100 Hz the bandwidth of the 1/3-octave analyzer is 23 Hz, but at 10 kHz the bandwidth is 2,300
Hz. Obviously, it intercepts much greater noise energy in a 1/3-octave band centered at 10 kHz than
one centered at 100 Hz. Measuring white noise with a constant-percentage analyzer would give an
upward-sloping result with a slope of 3 dB/octave (see Fig. 5-16B).
In many audio-frequency measurements, a flat response throughout the frequency range is the
desired characteristic of many instruments and rooms. Assume that the system to be measured has a
frequency characteristic that is almost flat. If this system is driven with white noise and measured
with a constant-percentage analyzer, the result would have an upward slope of 3 dB/octave. It would
be more desirable if the measured result was nominally flat so that deviations from flatness would be
very apparent. This can be accomplished by using a noise with a downward slope of 3 dB/octave,
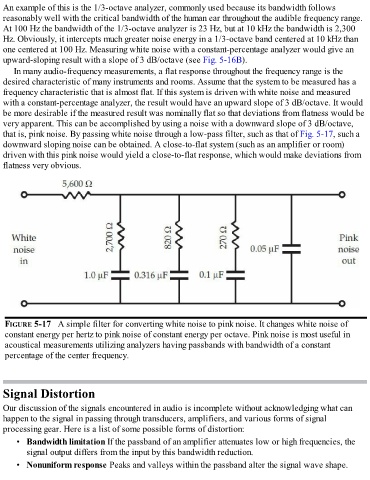
that is, pink noise. By passing white noise through a low-pass filter, such as that of Fig. 5-17, such a
downward sloping noise can be obtained. A close-to-flat system (such as an amplifier or room)
driven with this pink noise would yield a close-to-flat response, which would make deviations from
flatness very obvious.
FIGURE 5-17 A simple filter for converting white noise to pink noise. It changes white noise of
constant energy per hertz to pink noise of constant energy per octave. Pink noise is most useful in
acoustical measurements utilizing analyzers having passbands with bandwidth of a constant
percentage of the center frequency.
Signal Distortion
Our discussion of the signals encountered in audio is incomplete without acknowledging what can
happen to the signal in passing through transducers, amplifiers, and various forms of signal
processing gear. Here is a list of some possible forms of distortion:
• Bandwidth limitation If the passband of an amplifier attenuates low or high frequencies, the
signal output differs from the input by this bandwidth reduction.
• Nonuniform response Peaks and valleys within the passband alter the signal wave shape.