
Page 128 - Master Handbook of Acoustics
P. 128
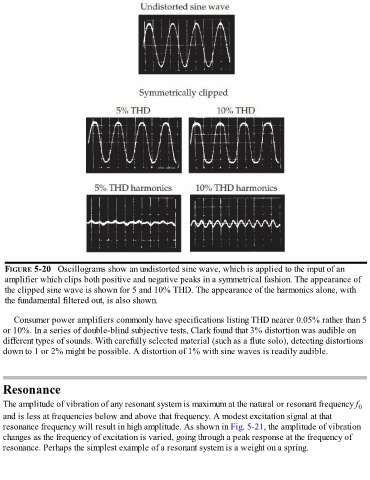
FIGURE 5-20   Oscillograms show an undistorted sine wave, which is applied to the input of an
   amplifier which clips both positive and negative peaks in a symmetrical fashion. The appearance of
   the clipped sine wave is shown for 5 and 10% THD. The appearance of the harmonics alone, with
   the fundamental filtered out, is also shown.


      Consumer power amplifiers commonly have specifications listing THD nearer 0.05% rather than 5
  or 10%. In a series of double-blind subjective tests, Clark found that 3% distortion was audible on

  different types of sounds. With carefully selected material (such as a flute solo), detecting distortions
  down to 1 or 2% might be possible. A distortion of 1% with sine waves is readily audible.


  Resonance


  The amplitude of vibration of any resonant system is maximum at the natural or resonant frequency f                   0
  and is less at frequencies below and above that frequency. A modest excitation signal at that
  resonance frequency will result in high amplitude. As shown in Fig. 5-21, the amplitude of vibration

  changes as the frequency of excitation is varied, going through a peak response at the frequency of
  resonance. Perhaps the simplest example of a resonant system is a weight on a spring.