
Page 127 - Master Handbook of Acoustics
P. 127
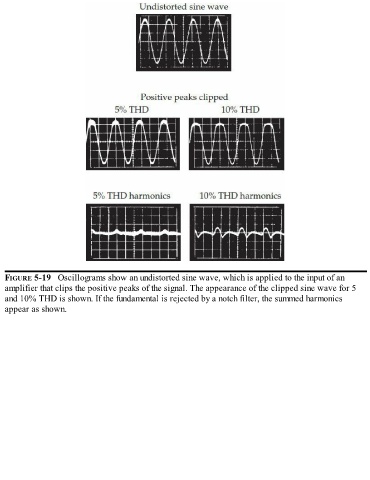
FIGURE 5-19   Oscillograms show an undistorted sine wave, which is applied to the input of an

   amplifier that clips the positive peaks of the signal. The appearance of the clipped sine wave for 5
   and 10% THD is shown. If the fundamental is rejected by a notch filter, the summed harmonics
   appear as shown.