
Page 311 - Materials Science and Engineering An Introduction
P. 311
8.13 Stress and Temperature Effects • 283
Rupture
×
Creep strain, ∆ ∆t Tertiary
Primary
T > T > T
3 2 1
× > >
3 2 1
×
T or 3
3
Creep strain T or 2
Secondary ×
2
Instantaneous Time, t t r T or 1
1
deformation
Figure 8.29 Typical creep curve of strain versus T < 0.4T m
time at constant load and constant elevated tempera-
ture. The minimum creep rate P/ t is the slope of Time
the linear segment in the secondary region. Rupture Figure 8.30 Influence of stress s and temperature T
lifetime t r is the total time to rupture. on creep behavior.
The results of creep rupture tests are most commonly presented as the logarithm of
stress versus the logarithm of rupture lifetime. Figure 8.31 is one such plot for an S-590 al-
loy in which a set of linear relationships can be seen to exist at each temperature. For some
alloys and over relatively large stress ranges, nonlinearity in these curves is observed.
Empirical relationships have been developed in which the steady-state creep rate as
a function of stress and temperature is expressed. Its dependence on stress can be written
Dependence of creep #
strain rate on stress P s = K 1 s n (8.24)
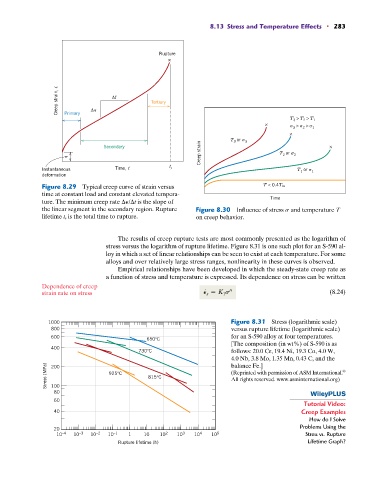
1000 Figure 8.31 Stress (logarithmic scale)
800 versus rupture lifetime (logarithmic scale)
600 for an S-590 alloy at four temperatures.
650°C
[The composition (in wt%) of S-590 is as
400
730°C follows: 20.0 Cr, 19.4 Ni, 19.3 Co, 4.0 W,
4.0 Nb, 3.8 Mo, 1.35 Mn, 0.43 C, and the
balance Fe.]
Stress (MPa) 925°C 815°C (Reprinted with permission of ASM International.
200
®
All rights reserved. www.asminternational.org)
100
80
60
Tutorial Video:
40 Creep Examples
How do I Solve
Problems Using the
20
10 –4 10 –3 10 –2 10 –1 1 10 10 2 10 3 10 4 10 5 Stress vs. Rupture
Rupture lifetime (h) Lifetime Graph?