
Page 314 - Materials Science and Engineering An Introduction
P. 314
286 • Chapter 8 / Failure
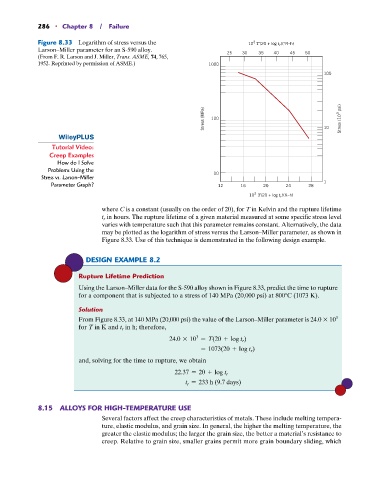
Figure 8.33 Logarithm of stress versus the 10 T(20 + log t r )(°R–h)
3
Larson–Miller parameter for an S-590 alloy.
(From F. R. Larson and J. Miller, Trans. ASME, 74, 765, 25 30 35 40 45 50
1952. Reprinted by permission of ASME.) 1000
100
Stress (MPa) 100 10 Stress (10 3 psi)
Tutorial Video:
Creep Examples
How do I Solve
Problems Using the
10
Stress vs. Larson-Miller
1
Parameter Graph? 12 16 20 24 28
3
10 T(20 + log t r )(K–h)
where C is a constant (usually on the order of 20), for T in Kelvin and the rupture lifetime
t r in hours. The rupture lifetime of a given material measured at some specific stress level
varies with temperature such that this parameter remains constant. Alternatively, the data
may be plotted as the logarithm of stress versus the Larson–Miller parameter, as shown in
Figure 8.33. Use of this technique is demonstrated in the following design example.
DESIGN EXAMPLE 8.2
Rupture Lifetime Prediction
Using the Larson–Miller data for the S-590 alloy shown in Figure 8.33, predict the time to rupture
for a component that is subjected to a stress of 140 MPa (20,000 psi) at 800 C (1073 K).
Solution
From Figure 8.33, at 140 MPa (20,000 psi) the value of the Larson–Miller parameter is 24.0 10
3
for T in K and t r in h; therefore,
3
24.0 * 10 = T(20 + log t r )
= 1073(20 + log t r )
and, solving for the time to rupture, we obtain
22.37 = 20 + log t r
t r = 233 h (9.7 days)
8.15 ALLOYS FOR HIGH-TEMPERATURE USE
Several factors affect the creep characteristics of metals. These include melting tempera-
ture, elastic modulus, and grain size. In general, the higher the melting temperature, the
greater the elastic modulus; the larger the grain size, the better a material’s resistance to
creep. Relative to grain size, smaller grains permit more grain boundary sliding, which