
Page 119 - Materials Chemistry, Second Edition
P. 119
106 2 Solid-State Chemistry
representative work functions for metals and semiconductors are Li: 2.93 eV, Na:
2.36 eV, Al: 4.1 eV, Ag(110): 4.64 eV, Ag(111): 4.74 eV, W: 4.35 eV, Si: 4.7 eV,
Ge: 5 eV.
At absolute zero, the highest occupied energy level is referred to as the Fermi
level (in 3-D: Fermi surface), derived from Fermi-Dirac statistics. [59] The Fermi-
Dirac distribution function, f(E), describes the probability that a given available
energy state will be occupied at a given temperature:
1
ð35Þ f ðEÞ¼
e ðE E F Þ=kT þ 1
where: k ¼ Boltzmann’s constant (1.38 10 23 J/K)
E ¼ available energy state
E F ¼ Fermi level
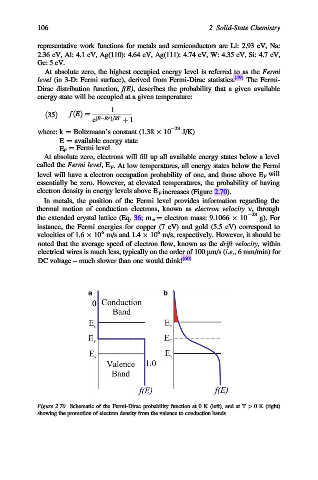
At absolute zero, electrons will fill up all available energy states below a level
called the Fermi level,E F . At low temperatures, all energy states below the Fermi
level will have a electron occupation probability of one, and those above E F will
essentially be zero. However, at elevated temperatures, the probability of having
electron density in energy levels above E F increases (Figure 2.70).
In metals, the position of the Fermi level provides information regarding the
thermal motion of conduction electrons, known as electron velocity n, through
the extended crystal lattice (Eq. 36;m e ¼ electron mass: 9.1066 10 28 g). For
instance, the Fermi energies for copper (7 eV) and gold (5.5 eV) correspond to
6
6
velocities of 1.6 10 m/s and 1.4 10 m/s, respectively. However, it should be
noted that the average speed of electron flow, known as the drift velocity, within
electrical wires is much less, typically on the order of 100 mm/s (i.e., 6 mm/min) for
[60]
DC voltage – much slower than one would think!
Figure 2.70. Schematic of the Fermi-Dirac probability function at 0 K (left), and at T > 0 K (right)
showing the promotion of electron density from the valence to conduction bands.