
Page 120 - Materials Chemistry, Second Edition
P. 120
107
2.3. The Crystalline State
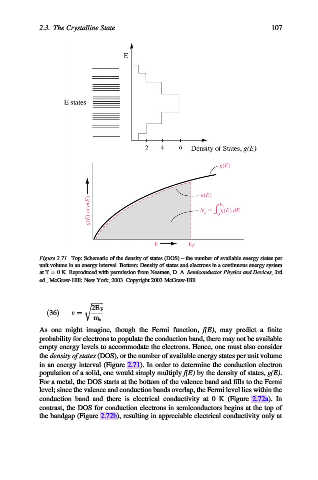
Figure 2.71. Top: Schematic of the density of states (DOS) – the number of available energy states per
unit volume in an energy interval. Bottom: Density of states and electrons in a continuous energy system
at T ¼ 0 K. Reproduced with permission from Neamen, D. A. Semiconductor Physics and Devices, 3rd
ed., McGraw-Hill: New York, 2003. Copyright 2003 McGraw-Hill.
r ffiffiffiffiffiffiffiffi
2E F
ð36Þ n ¼
m e
As one might imagine, though the Fermi function, f(E), may predict a finite
probability for electrons to populate the conduction band, there may not be available
empty energy levels to accommodate the electrons. Hence, one must also consider
the density of states (DOS), or the number of available energy states per unit volume
in an energy interval (Figure 2.71). In order to determine the conduction electron
population of a solid, one would simply multiply f(E) by the density of states, g(E).
For a metal, the DOS starts at the bottom of the valence band and fills to the Fermi
level; since the valence and conduction bands overlap, the Fermi level lies within the
conduction band and there is electrical conductivity at 0 K (Figure 2.72a). In
contrast, the DOS for conduction electrons in semiconductors begins at the top of
the bandgap (Figure 2.72b), resulting in appreciable electrical conductivity only at