
Page 103 - Mathematical Models and Algorithms for Power System Optimization
P. 103
New Algorithms Related to Power Flow 93
• Location of reference or slack bus
The data were tested by changing the location of the slack bus. However, both the methods
converged for this kind of ill-conditioned system.
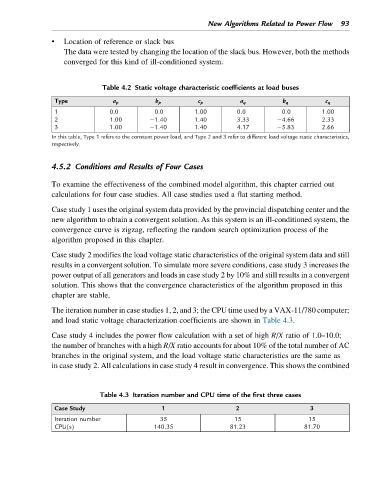
Table 4.2 Static voltage characteristic coefficients at load buses
Type a p b p c p a q b q c q
1 0.0 0.0 1.00 0.0 0.0 1.00
2 1.00 1.40 1.40 3.33 4.66 2.33
3 1.00 1.40 1.40 4.17 5.83 2.66
In this table, Type 1 refers to the constant power load, and Type 2 and 3 refer to different load voltage static characteristics,
respectively.
4.5.2 Conditions and Results of Four Cases
To examine the effectiveness of the combined model algorithm, this chapter carried out
calculations for four case studies. All case studies used a flat starting method.
Case study 1 uses the original system data provided by the provincial dispatching center and the
new algorithm to obtain a convergent solution. As this system is an ill-conditioned system, the
convergence curve is zigzag, reflecting the random search optimization process of the
algorithm proposed in this chapter.
Case study 2 modifies the load voltage static characteristics of the original system data and still
results in a convergent solution. To simulate more severe conditions, case study 3 increases the
power output of all generators and loads in case study 2 by 10% and still results in a convergent
solution. This shows that the convergence characteristics of the algorithm proposed in this
chapter are stable.
The iteration number in case studies 1, 2, and 3; the CPU time used by a VAX-11/780 computer;
and load static voltage characterization coefficients are shown in Table 4.3.
Case study 4 includes the power flow calculation with a set of high R/X ratio of 1.0–10.0;
the number of branches with a high R/X ratio accounts for about 10% of the total number of AC
branches in the original system, and the load voltage static characteristics are the same as
in case study 2. All calculations in case study 4 result in convergence. This shows the combined
Table 4.3 Iteration number and CPU time of the first three cases
Case Study 1 2 3
Iteration number 35 15 15
CPU(s) 140.35 81.23 81.70