
Page 104 - Mathematical Models and Algorithms for Power System Optimization
P. 104
94 Chapter 4
model algorithm proposed in this chapter retains good convergence characteristics of the
N-R method for high R/X ratio systems. Table 4.4 gives the iteration number and CPU
times for the calculation results of case study 4.
Table 4.4 Calculation results of case 4 (iteration number and CPU time)
R/X Ratio 2.0 3.0 4.0 5.0 10.0
Iteration 16 16 16 16 16
number
CPU(s) 83.95 83.88 84.45 84.00 84.41
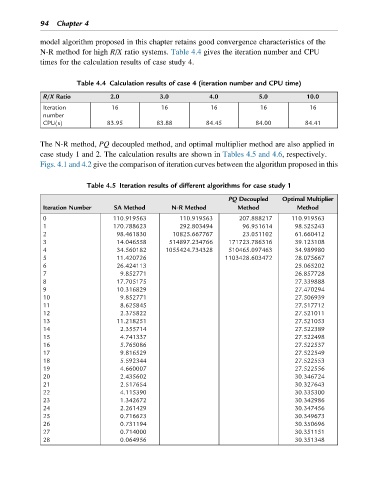
The N-R method, PQ decoupled method, and optimal multiplier method are also applied in
case study 1 and 2. The calculation results are shown in Tables 4.5 and 4.6, respectively.
Figs. 4.1 and 4.2 give the comparison of iteration curves between the algorithm proposed in this
Table 4.5 Iteration results of different algorithms for case study 1
PQ Decoupled Optimal Multiplier
Iteration Number SA Method N-R Method Method Method
0 110.919563 110.919563 207.888217 110.919563
1 170.788623 292.803494 96.951614 98.525243
2 98.461830 10825.667767 23.051102 61.660412
3 14.046558 514897.234766 171723.786316 39.123108
4 34.560182 1055424.734328 510465.097463 34.989980
5 11.420726 1103428.603472 28.075667
6 26.424113 25.065202
7 9.852771 26.857728
8 17.705175 27.339888
9 10.316829 27.470294
10 9.852771 27.506939
11 8.625845 27.517712
12 2.375822 27.521011
13 11.218251 27.521053
14 2.355714 27.522389
15 4.741337 27.522498
16 5.765086 27.522537
17 9.816529 27.522549
18 5.592344 27.522553
19 4.660007 27.522556
20 2.435602 30.346724
21 2.517654 30.327643
22 4.115390 30.335300
23 1.342672 30.342986
24 2.261429 30.347456
25 0.716623 30.349673
26 0.731194 30.350696
27 0.714000 30.351151
28 0.064956 30.351348