
Page 308 - Mechanical design of microresonators _ modeling and applications
P. 308
0-07-145538-8_CH06_307_08/30/05
Microcantilever and Microbridge Systems for Mass Detection
Microcantilever and Microbridge Systems for Mass Detection 307
1.95
0.1
ω b,0 / ω b
1.75
0 0
f m
c l -6
1 1 1 × 10
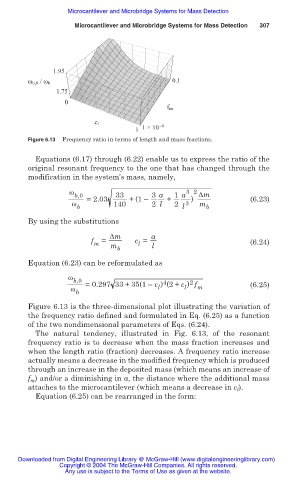
Figure 6.13 Frequency ratio in terms of length and mass fractions.
Equations (6.17) through (6.22) enable us to express the ratio of the
original resonant frequency to the one that has changed through the
modification in the system’s mass, namely,
Ȧ 3 2
b,0 =2.03 33 + (1– 3 a + 1 a ) ǻm (6.23)
Ȧ 140 2 l 2 3 m
b l b
By using the substitutions
ǻm a
f m = c = (6.24)
l
m
b l
Equation (6.23) can be reformulated as
Ȧ
b,0 4 2
=0.297 33 + 35(1– c ) (2+ c ) f (6.25)
Ȧ l l m
b
Figure 6.13 is the three-dimensional plot illustrating the variation of
the frequency ratio defined and formulated in Eq. (6.25) as a function
of the two nondimensional parameters of Eqs. (6.24).
The natural tendency, illustrated in Fig. 6.13, of the resonant
frequency ratio is to decrease when the mass fraction increases and
when the length ratio (fraction) decreases. A frequency ratio increase
actually means a decrease in the modified frequency which is produced
through an increase in the deposited mass (which means an increase of
f m ) and/or a diminishing in a, the distance where the additional mass
attaches to the microcantilever (which means a decrease in c ).
l
Equation (6.25) can be rearranged in the form:
Downloaded from Digital Engineering Library @ McGraw-Hill (www.digitalengineeringlibrary.com)
Copyright © 2004 The McGraw-Hill Companies. All rights reserved.
Any use is subject to the Terms of Use as given at the website.