
Page 428 - Mechanical Engineers' Handbook (Volume 2)
P. 428
9 Graphical Design Methods 419
Figure 39 Structure of pseudoderivative feedback.
functions are useful. The Bode plot and the Nyquist plot present the frequency response
information in different forms. Each form has its own advantages. The root-locus plot shows
the location of the characteristic roots for a range of values of some parameters, such as a
controller gain. A tabulation of these plots for typical transfer functions is given in the
previous chapter (Fig. 27.8). The design of two-position and other nonlinear control systems
is facilitated by the describing function, which is a linearized approximation based on the
frequency response of the controller (see Section 27.8.4). Graphical design methods are
discussed in more detail in Refs. 1–4.
9.1 The Nyquist Stability Theorem
The Nyquist stability theorem is a powerful tool for linear system analysis. If the open-loop
system has no poles with positive real parts, we can concentrate our attention on the region
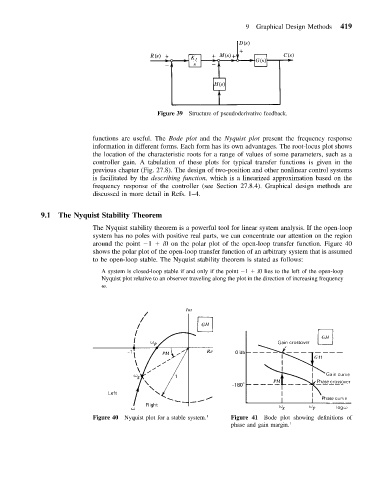
around the point 1 i0 on the polar plot of the open-loop transfer function. Figure 40
shows the polar plot of the open-loop transfer function of an arbitrary system that is assumed
to be open-loop stable. The Nyquist stability theorem is stated as follows:
A system is closed-loop stable if and only if the point 1 i0 lies to the left of the open-loop
Nyquist plot relative to an observer traveling along the plot in the direction of increasing frequency
.
Figure 40 Nyquist plot for a stable system. 1 Figure 41 Bode plot showing definitions of
phase and gain margin. 1