
Page 90 - Mechanical Engineers' Handbook (Volume 2)
P. 90
3 The Resistance Strain Gage 79
Strain gages are seldom damaged by excitation voltages in excess of proper values, but
performance degrades. The voltage applied to a strain gage bridge creates a power loss in
each arm which must be dissipated in the form of heat. By its basic design, all of the power
input to the bridge is dissipated in the bridge with none available to the output circuit. The
sensing grid of every strain gage then operates at a higher temperature than the transducer
flexure to which it is bonded. The heat generated within the gage must be transferred by
conduction to the flexure. Heat flow into the flexure causes a temperature rise which is a
function of its heat sink capacity and gage power level. The optimum excitation level for
strain gage applications is a function of the strain gage grid area, gage resistance, heat sink
properties of the mounting surface, environmental operating temperature range of the gage
installation, required operational specifications, and installation and wiring techniques. Rigid
operating requirements for precision transducers require performance verification of the op-
timum excitation level. Zero shift versus load and stability under load at the maximum
operating temperature are the performance tests most sensitive to excessive excitation volt-
age.
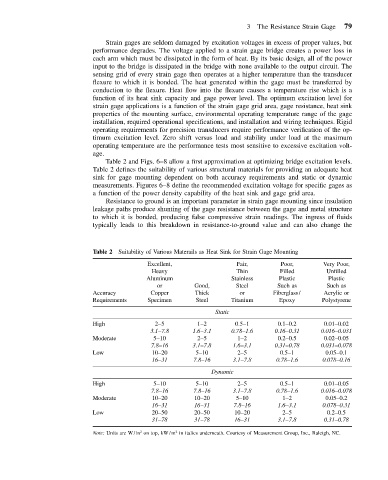
Table 2 and Figs. 6–8 allow a first approximation at optimizing bridge excitation levels.
Table 2 defines the suitability of various structural materials for providing an adequate heat
sink for gage mounting dependent on both accuracy requirements and static or dynamic
measurements. Figures 6–8 define the recommended excitation voltage for specific gages as
a function of the power density capability of the heat sink and gage grid area.
Resistance to ground is an important parameter in strain gage mounting since insulation
leakage paths produce shunting of the gage resistance between the gage and metal structure
to which it is bonded, producing false compressive strain readings. The ingress of fluids
typically leads to this breakdown in resistance-to-ground value and can also change the
Table 2 Suitability of Various Materails as Heat Sink for Strain Gage Mounting
Excellent, Fair, Poor, Very Poor,
Heavy Thin Filled Unfilled
Aluminum Stainless Plastic Plastic
or Good, Steel Such as Such as
Accuracy Copper Thick or Fiberglass/ Acrylic or
Requirements Specimen Steel Titanium Epoxy Polystyrene
Static
High 2–5 1–2 0.5–1 0.1–0.2 0.01–0.02
3.1–7.8 1.6–3.1 0.78–1.6 0.16–0.31 0.016–0.031
Moderate 5–10 2–5 1–2 0.2–0.5 0.02–0.05
7.8–16 3.1–7.8 1.6–3.1 0.31–0.78 0.031–0.078
Low 10–20 5–10 2–5 0.5–1 0.05–0.1
16–31 7.8–16 3.1–7.8 0.78–1.6 0.078–0.16
Dynamic
High 5–10 5–10 2–5 0.5–1 0.01–0.05
7.8–16 7.8–16 3.1–7.8 0.78–1.6 0.016–0.078
Moderate 10–20 10–20 5–10 1–2 0.05–0.2
16–31 16–31 7.8–16 1.6–3.1 0.078–0.31
Low 20–50 20–50 10–20 2–5 0.2–0.5
31–78 31–78 16–31 3.1–7.8 0.31–0.78
2
2
Note: Units are W/in on top, kW/m in italics underneath. Courtesy of Measurement Group, Inc., Raleigh, NC.