Page 358 - Mechanical Engineers' Handbook (Volume 4)
P. 358

3 Heat Transport Limitations  347

                                                                d
                                                    0  K   0        0    at s   0               (35)
                                                                ds
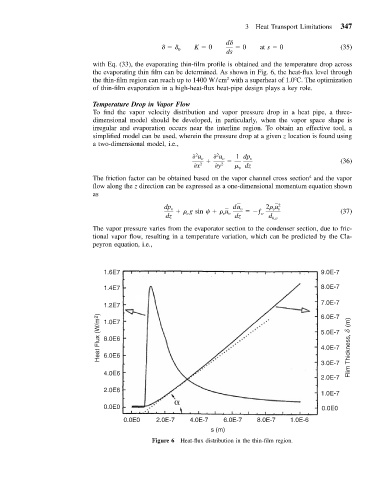
                           with Eq. (33), the evaporating thin-film profile is obtained and the temperature drop across
                           the evaporating thin film can be determined. As shown in Fig. 6, the heat-flux level through
                           the thin-film region can reach up to 1400 W/cm with a superheat of 1.0 C. The optimization
                                                                2
                           of thin-film evaporation in a high-heat-flux heat-pipe design plays a key role.

                           Temperature Drop in Vapor Flow
                           To find the vapor velocity distribution and vapor pressure drop in a heat pipe, a three-
                           dimensional model should be developed, in particularly, when the vapor space shape is
                           irregular and evaporation occurs near the interline region. To obtain an effective tool, a
                           simplified model can be used, wherein the pressure drop at a given z location is found using
                           a two-dimensional model, i.e.,

                                                       2
                                                      
 u v     
 u v     1 dp v                (36)
                                                             2
                                                       
x 2  
y 2    dz
                                                                   v
                                                                                       4
                           The friction factor can be obtained based on the vapor channel cross section and the vapor
                           flow along the z direction can be expressed as a one-dimensional momentum equation shown
                           as
                                               dp v      g sin       u  du v    ƒ  2  u 2       (37)
                                                                             v v
                                               dz    v         v v  dz    v  d h,v
                           The vapor pressure varies from the evaporator section to the condenser section, due to fric-
                           tional vapor flow, resulting in a temperature variation, which can be predicted by the Cla-
                           peyron equation, i.e.,


                              1.6E7                                                       9.0E-7

                              1.4E7                                                       8.0E-7
                              1.2E7                                                       7.0E-7
                             Heat Flux (W/m 2 )  1.0E7                                    5.0E-7  Flim Thickness, δ (m)
                                                                                          6.0E-7

                              8.0E6
                                                                                          4.0E-7
                              6.0E6
                                                                                          3.0E-7
                              4.0E6
                                                                                          2.0E-7
                              2.0E6
                                                                                          1.0E-7

                              0.0E0                                                       0.0E0
                                                                                             0.0E-7
                                   0.0E0    2.0E-7    4.0E-7   6.0E-7   8.0E-7    1.0E-6
                                                            s (m)
                                           Figure 6 Heat-flux distribution in the thin-film region.
   353   354   355   356   357   358   359   360   361   362   363