
Page 480 - Mechanical Engineers' Handbook (Volume 4)
P. 480
1 Cryogenics and Cryofluid Properties 469
Table 2 Equilibrium Para-Hydrogen Concentration as a
Function of T (K)
Equilibrium Percentage of
T (K) Para-Hydrogen
20 99.82
30 96.98
40 88.61
60 65.39
80 48.39
100 38.51
150 28.54
273 25.13
500 25.00
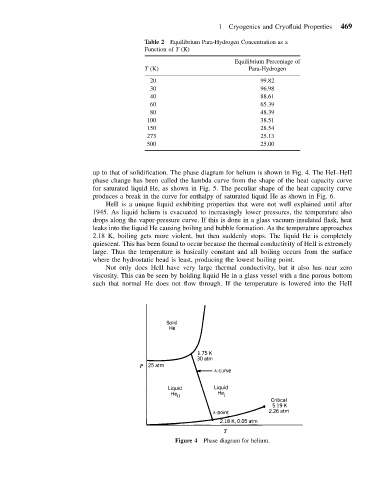
up to that of solidification. The phase diagram for helium is shown in Fig. 4. The HeI–HeII
phase change has been called the lambda curve from the shape of the heat capacity curve
for saturated liquid He, as shown in Fig. 5. The peculiar shape of the heat capacity curve
produces a break in the curve for enthalpy of saturated liquid He as shown in Fig. 6.
HeII is a unique liquid exhibiting properties that were not well explained until after
1945. As liquid helium is evacuated to increasingly lower pressures, the temperature also
drops along the vapor-pressure curve. If this is done in a glass vacuum-insulated flask, heat
leaks into the liquid He causing boiling and bubble formation. As the temperature approaches
2.18 K, boiling gets more violent, but then suddenly stops. The liquid He is completely
quiescent. This has been found to occur because the thermal conductivity of HeII is extremely
large. Thus the temperature is basically constant and all boiling occurs from the surface
where the hydrostatic head is least, producing the lowest boiling point.
Not only does HeII have very large thermal conductivity, but it also has near zero
viscosity. This can be seen by holding liquid He in a glass vessel with a fine porous bottom
such that normal He does not flow through. If the temperature is lowered into the HeII
Figure 4 Phase diagram for helium.