
Page 108 - Singiresu S. Rao-Mechanical Vibrations in SI Units, Global Edition-Pearson (2017)
P. 108
1.12 examples usinG matlab 105
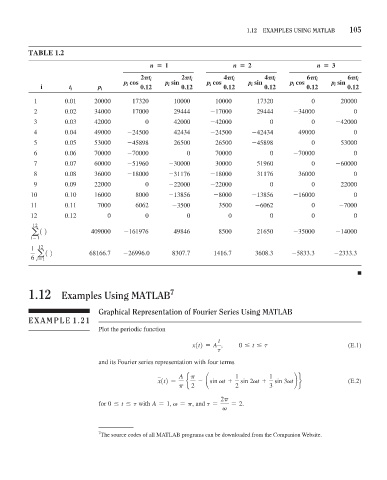
TABlE 1.2
n 1 n 2 n 3
2Pt i 2Pt i 4Pt i 4Pt i 6Pt i 6Pt i
p i cos p i sin p i cos p i sin p i cos p i sin
i t i p i 0.12 0.12 0.12 0.12 0.12 0.12
1 0.01 20000 17320 10000 10000 17320 0 20000
2 0.02 34000 17000 29444 -17000 29444 -34000 0
3 0.03 42000 0 42000 -42000 0 0 -42000
4 0.04 49000 -24500 42434 -24500 -42434 49000 0
5 0.05 53000 -45898 26500 26500 -45898 0 53000
6 0.06 70000 -70000 0 70000 0 -70000 0
7 0.07 60000 -51960 -30000 30000 51960 0 -60000
8 0.08 36000 -18000 -31176 -18000 31176 36000 0
9 0.09 22000 0 -22000 -22000 0 0 22000
10 0.10 16000 8000 -13856 -8000 -13856 -16000 0
11 0.11 7000 6062 -3500 3500 -6062 0 -7000
12 0.12 0 0 0 0 0 0 0
12
a 1 2 409000 -161976 49846 8500 21650 -35000 -14000
i = 1
1 12
a 1 2 68166.7 -26996.0 8307.7 1416.7 3608.3 -5833.3 -2333.3
6 i = 1
■
1.12 examples using matlab 7
Graphical representation of Fourier series using matlab
example 1.21
Plot the periodic function
t
x1t2 = A , 0 … t … t (E.1)
t
and its Fourier series representation with four terms
A p 1 1
x1t2 = b - ¢sin vt + sin 2vt + sin 3vt≤ r (E.2)
p 2 2 3
2p
for 0 … t … t with A = 1, v = p, and t = = 2.
v
7 The source codes of all MATLAB programs can be downloaded from the Companion Website.