
Page 335 - Mechanics Analysis Composite Materials
P. 335
320 Mechanics and analysis of composite materials
El ,%
1.5 Q, = 600 MPa
03
6,= 450 MPa
02
1
6,= 300 MPa
01
0.5
0 ' t, Days (24 hours)
0 200 400 600 800 1000
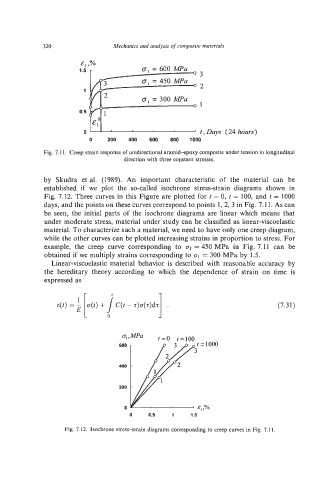
Fig. 7.1 1. Creep strain response of unidirectional aramid-epoxy composite under tension in longitudinal
direction with three constant stresses.
by Skudra et al. (1989). An important characteristic of the material can be
established if we plot the so-called isochrone stress-strain diagrams shown in
Fig. 7.12. Three curves in this Figure are plotted for t = 0, t = 100, and t = 1000
days, and the points on these curves correspond to points 1,2,3 in Fig. 7.1 1. As can
be seen, the initial parts of the isochrone diagrams are linear which means that
under moderate stress, material under study can be classified as linear-viscoelastic
material. To characterize such a material, we need to have only one creep diagram,
while the other curves can be plotted increasing strains in proportion to stress. For
example, the creep curve corresponding to 51 = 450 MPa in Fig. 7.11 can be
obtained if we multiply strains corresponding to cq = 300 MPa by 1.5.
Linear-viscoelastic material behavior is described with reasonable accuracy by
the hereditary theory according to which the dependence of strain on time is
expressed as
1
4 ii
~(t)= - ~(t)+ C(t - T)CT(T)~T . (7.31)
0 0.5 1 1.5
Fig. 7.12. Isochrone stress-strain diagrams corresponding to creep curves in Fig. 7.1 1