Page 164 - Mechanics of Asphalt Microstructure and Micromechanics
P. 164

156   Ch a p t e r  Fiv e


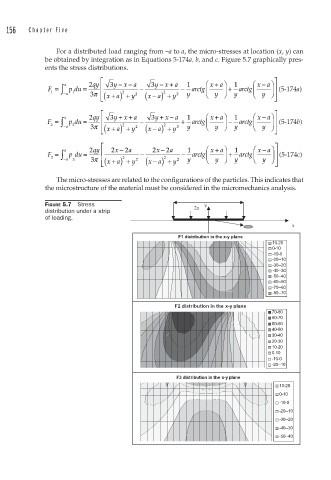
                 For a distributed load ranging from –a to a, the micro-stresses at location (x, y) can
              be obtained by integration as in Equations 5-174a, b, and c. Figure 5.7 graphically pres-
              ents the stress distributions.
                             ⎡  3 −−       3 −+              + ⎞          − ⎞  ⎤
                           qy
               1 ∫
              F =  − a  p du =  2 3π ⎢ ⎢  y x a  −  yx a  −  1  arctg ⎛ xa ⎟  +  1  arctg ⎛ xa ⎟  ⎥ (5-174a)
                                                                        ⎜
                                                           ⎜
                                              )
                                   2
                     1
                                               2
                                +
                                            −
                    a
                                       2
                             ⎣ ⎣ ( xa) + y ( xa) + y  2  y  ⎝ y  ⎠  y   ⎝ y  ⎠ ⎥ ⎦
                             ⎡  3 ++       3 +−              + ⎞           − ⎞ ⎤
               2 ∫
              F =  a  p du =  2 qy  ⎢  y x a  −  yx a  +  1  arctg ⎛ xa ⎟  −  1  arctg ⎛ xa ⎟ ⎥ (5-174b)
                                                           ⎜
                                                                        ⎜
                                              )
                          3π ⎢
                                   2
                   −
                     2
                                               2
                                +
                                            −
                                       2
                    a
                             ⎣ ⎣ ( xa) + y ( xa) + y  2  y  ⎝ y  ⎠  y   ⎝ y  ⎠ ⎥ ⎦
                             ⎡   x 2−       2 −              + ⎞           − ⎞ ⎤
               3 ∫
              F =  a  p du =  2 qy ⎢  2  2  a  −  x 2 a  −  1  arctg ⎛ xa ⎟  +  1  arctg ⎛ xa ⎟  ⎥ (5-174c)
                                                           ⎜
                                                                        ⎜
                          3π ⎢
                                               2
                   −
                                                +
                                +
                                            −
                    a
                     3
                                       2
                             ⎣ ⎢ ( xa) + y ( xa) + y 2  y  ⎝ y  ⎠  y    ⎝ y  ⎠ ⎥ ⎦
                 The micro-stresses are related to the configurations of the particles. This indicates that
              the microstructure of the material must be considered in the micromechanics analysis.
              FIGURE 5.7  Stress                          y
                                                       2a
              distribution under a strip
              of loading.
                                                                                   x
                                                   F1 distribution in the x-y plane
                                                                             10-20
                                                                             0-10
                                                                             -10-0
                                                                             -20--10
                                                                             -30--20
                                                                             -40--30
                                                                             -50--40
                                                                             -60--50
                                                                             -70--60
                                                                             -80--70
                                                  F2 distribution in the x-y plane
                                                                             70-80
                                                                             60-70
                                                                             50-60
                                                                             40-50
                                                                             30-40
                                                                             20-30
                                                                             10-20
                                                                             0-10
                                                                             -10-0
                                                                             -20--10
                                                   F3 distribution in the x-y plane
                                                                               10-20
                                                                               0-10
                                                                               -10-0
                                                                               -20--10
                                                                               -30--20
                                                                               -40--30
                                                                               -50--40
   159   160   161   162   163   164   165   166   167   168   169