
Page 167 - Mechanics of Asphalt Microstructure and Micromechanics
P. 167
Mixture T heor y and Micromechanics Applications 159
maximum tensile forces may take place between Particles 1 and 2 and 5 and 6. In other
words, the top-down cracking may likely occur around the edges of the tire. This is
coincident with the conclusions drawn in Myers,- et al., (2001). However, the interpreta-
tion methods are so different: one uses a linear elastic fracture mechanics approach; the
other uses a micromechanics approach. The advantage of the micromechanics approach
lies in its capability to naturally incorporate the materials’ microstructure and the rela-
tive stiffness and strength of the constituents.
5.6.2 Doublet Mechanics Interpretation
From these formulations, it can be deduced that tensile micro-stress will generate in
certain zones, representing the causes of top-down cracking. Nevertheless, the analyti-
cal solution assumes a periodic materials structure, which is quite different from the
real structure of the materials. This microstructure difference implies that the real stress
distribution may be more complicated than that of theoretical predictions.
5.6.3 DEM Interpretation
To account for the more complicated structure of the material, the DEM, initially devel-
oped by Cundall (1979) to simulate the properties of granular soil, was applied to ana-
lyze the stress distribution. This method has also been applied to simulate the behavior
of AC in recent years (Chang and Meegoda, 1997, 1999). By allowing the particles to be
bonded together, this method can be used to simulate actual behavior of AC.
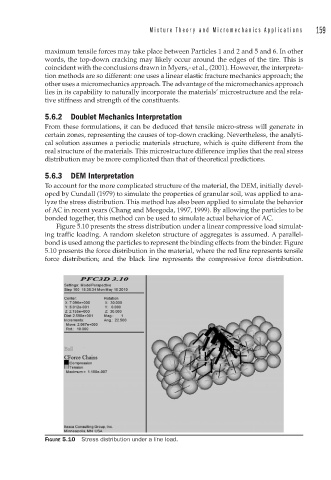
Figure 5.10 presents the stress distribution under a linear compressive load simulat-
ing traffic loading. A random skeleton structure of aggregates is assumed. A parallel-
bond is used among the particles to represent the binding effects from the binder. Figure
5.10 presents the force distribution in the material, where the red line represents tensile
force distribution; and the black line represents the compressive force distribution.
FIGURE 5.10 Stress distribution under a line load.