
Page 390 - Mechanics of Asphalt Microstructure and Micromechanics
P. 390
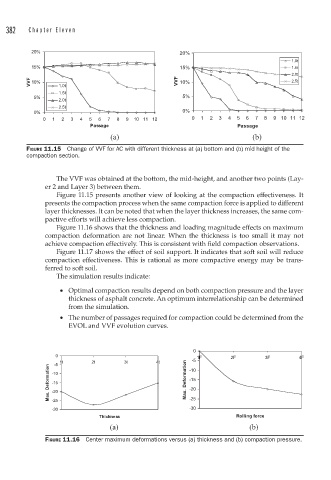
382   Ch a p t e r  E l ev e n


          20%                                      20%
                                                                                   1.0t
          15%                                      15%                             1.5t
                                                                                   2.0t
         VVF  10%  1.0t                            VVF  10%                        2.5t
                 1.5t
           5%                                       5%
                 2.0t
                 2.5t
           0%                                       0%
             0  1  2  3  4  5  6  7  8  9  10 11 12    0  1  2  3  4  5  6  7  8  9 10 11 12
                          Passage                                   Passage
                                   (a)                                                                   (b)
        FIGURE 11.15  Change of VVF for AC with different thickness at (a) bottom and (b) mid height of the
        compaction section.


                 The VVF was obtained at the bottom, the mid-height, and another two points (Lay-
              er 2 and Layer 3) between them.
                 Figure 11.15 presents another view of looking at the compaction effectiveness. It
              presents the compaction process when the same compaction force is applied to different
              layer thicknesses. It can be noted that when the layer thickness increases, the same com-
              pactive efforts will achieve less compaction.
                 Figure 11.16 shows that the thickness and loading magnitude effects on maximum
              compaction deformation are not linear. When the thickness is too small it may not
              achieve compaction effectively. This is consistent with field compaction observations.
                 Figure 11.17 shows the effect of soil support. It indicates that soft soil will reduce
              compaction effectiveness. This is rational as more compactive energy may be trans-
              ferred to soft soil.
                 The simulation results indicate:
                  •  Optimal compaction results depend on both compaction pressure and the layer
                    thickness of asphalt concrete. An optimum interrelationship can be determined
                    from the simulation.
                  •  The number of passages required for compaction could be determined from the
                    EVOL and VVF evolution curves.


                                                       0
                 0                                      1F        2F       3F        4F
                                                       -5
                  1t       2t       3t       4t       -10
                -5
               Max. Deformation  -10                 Max. Deformation  -15
                -15
                                                      -20
                -20
                -25
                                                      -30
                -30                                   -25
                             Thickness                             Rolling force
                                  (a)                                                                    (b)

              FIGURE 11.16  Center maximum deformations versus (a) thickness and (b) compaction pressure.